- You can download sample spectra from the SIRIUS website.
- For a quick start, you can also watch our video tutorials.
- To process a full LC-MS/MS run, you can also use your own
.mzMLfiles and run the following examples. This will first perform feature detection. Be aware that annotating 100s or 1000s of features may take a while.
Graphical User Interface
For a quick start, you can also watch our SIRIUS Short Course Tutorial Series introducing basic elements and functionality of the SIRIUS 6 GUI. Find more details on the GUI here.
Analyzing multiple compounds
SIRIUS’s “Batch mode” is equivalent to analyzing many compounds at once, each with one or more mass spectra. You can also use this workflow to analyze a single compound.
- Drag the files
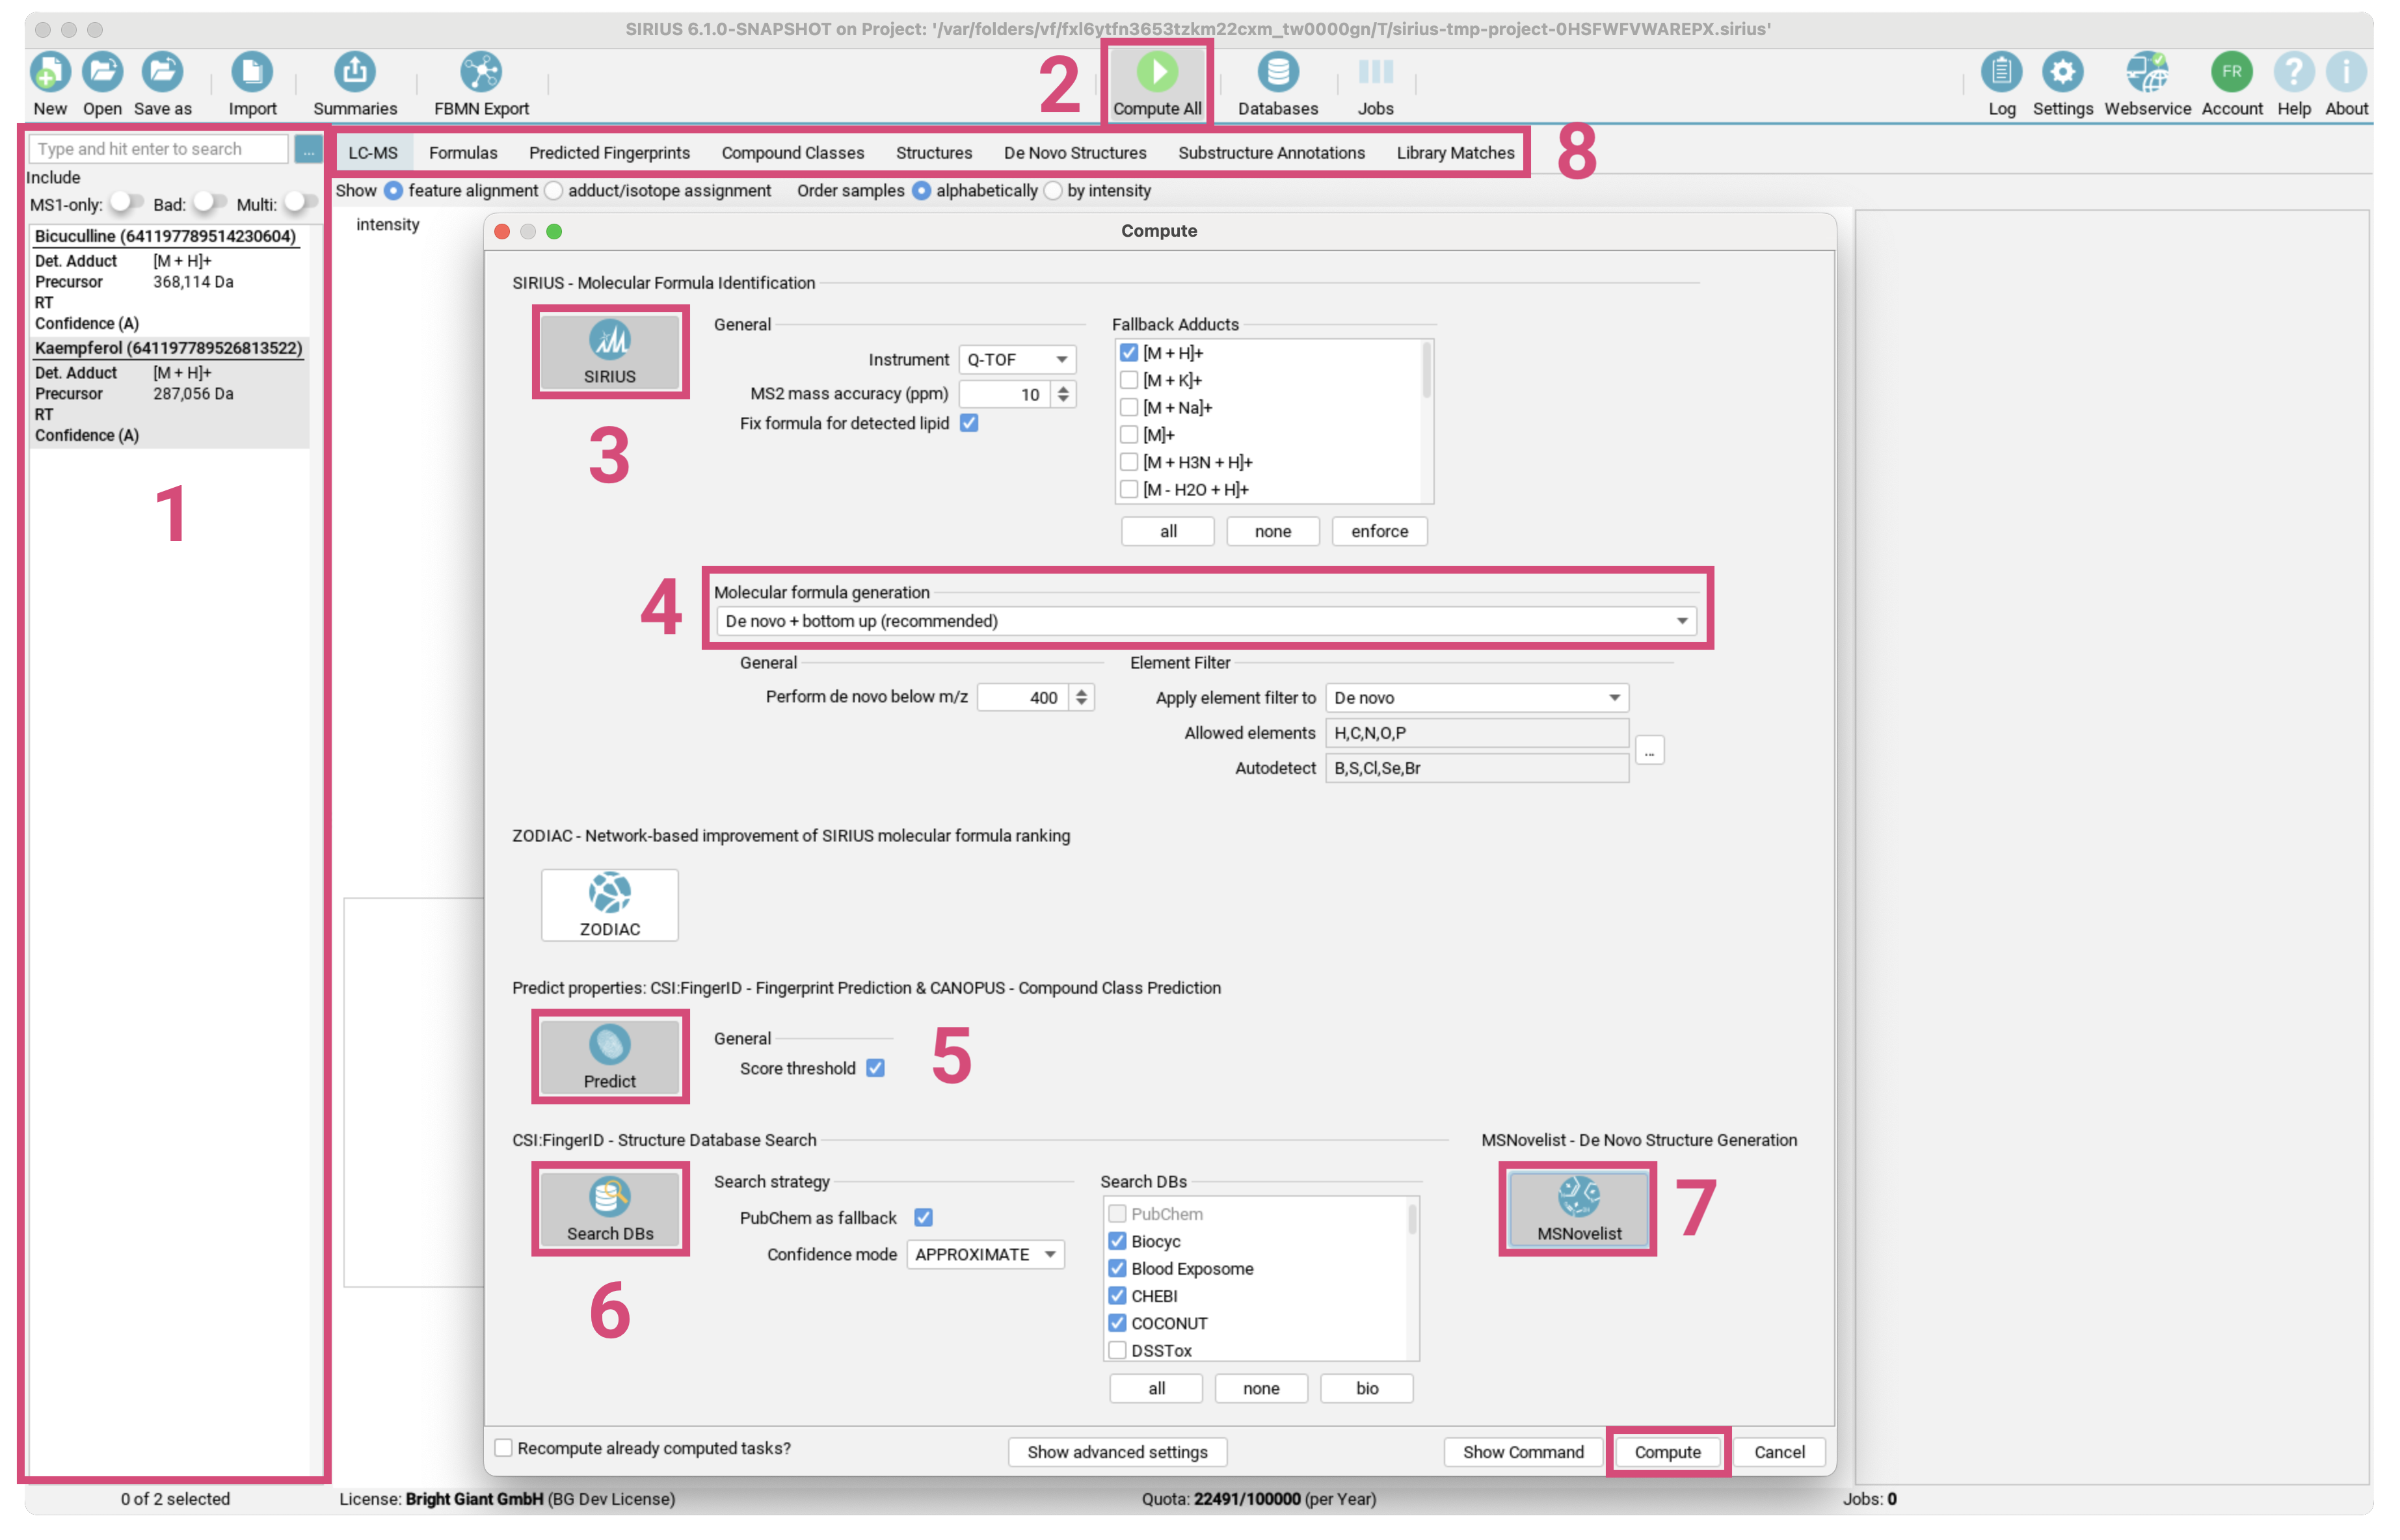
demo-data/ms/Bicuculline.msanddemo-data/ms/Kaempferol.msfrom the demo data into the application window. - The two compounds now appear in the compound list. [1]
- Verify that the ionization and parent masses are annotated correctly.
- Click the
Compute Allbutton. [2] - The default workflow is already preselected. [3]
SIRIUS - Molecular Formula Identificationto annotate molecular formulas from isotope pattern and MS/MS spectrumPredict properties: CSI:FingerID - Fingerprint Prediction & CANOPUS - Compound Class Predictionto predict the molecular fingerprints of the compounds with CSI:FingerID and their compound classes with CANOPUS.CSI:FingerID - Structure Database Searchto search compounds in a structure database with CSI:FingerID.
- Change the instrument type as well as the maximum mass deviation allowed. [4] Be aware that these settings will be used for all imported compounds.
- Verify that the currently selected molecular molecular formula generation strategy matches your research question. [5]
- Click
Compute. [6] - A gear icon appears in the lower right corner of each compound. This indicates that the compound is part of a computation job.
- Sometimes a computation can take a long time (e.g. for compounds
with many elements or very high masses). You can cancel
computations by selecting
Cancel Allin the toolbar. - Examine the results using the
Formulas,Compound Classes, andStructuresviews. For more details, use theSubstructure AnnotationandPredicted Fingerprintsviews. [7]
Command Line Interface
The demo data contains examples of three different data formats that can be read by SIRIUS. Find more details on the CLI here.
Example 1: MGF file
The MGF folder contains an example of an MGF file containing a single compound with mutliple MS/MS spectra measured on an Orbitrap instrument. SIRIUS recognizes that these MS/MS spectra belong to the same compound because they have the same parent mass. To analyze this compound, run:
sirius --input demo-data/mgf/laudanosine.mgf --project <project-space> formulas -p orbitrap fingerprints classes structures write-summaries --output <summary-files-dir>
This command runs 4 subtools at once: formulas (to identify molecular formulas),fingerprints (to predict molecular fingerprints), classes (to predict compound classes), and structures (to identify molecular structures).
Result sumamries are written into the <summary-files-dir>/.
If you wish to view the fragmentation trees, structures or compound classes visually, you can open the project space (<project-space>)
in the GUI and use the Formulas (for fragmentation trees), Structures, and Compound Classes views.
The output can be imported by dragging the <project-space> into the SIRIUS GUI application window.
Note that the viewer can also export the tree as vector graphics (SVG/PDF).
Example 2: MS files
The demo-data/ms/ directory contains two examples in .ms format. Each file contains a
single compound measured on an Orbitrap instrument. To analyze this
compound, run:
sirius --input demo-data/ms/Bicuculline.ms --project <projectspace> formulas -p orbitrap
for formula annotation only, or
sirius --input demo-data/ms/Bicuculline.ms --project <projectspace> formulas -p orbitrap fingerprints classes structures
for structure database search and compound class annotation.
Since the .ms file already contains the correct molecular formula, SIRIUS
will compute the fragmentation tree directly without having to decompose the mass (the same as when specifying exactly one molecular formula with the -f option).
If you want to enforce a molecular formula analysis and ranking
(even though the correct molecular formula is given in the file), use
the --ignore-formula option to ignore the molecular formula in the file.
The number of formula candidates can be specified with the -c option.
sirius --input demo-data/ms/Bicuculline.ms --ignore-formula --project <projectspace> formulas -p orbitrap -c 5
SIRIUS will ignore the correct molecular formula in the file and output the 5 best candidates.
Background Service - Generic SIRIUS API
SIRIUS provides a REST API to access data from the project space and to run computations. You can either interact with this API directly or use one of the SDKs which are provided for different programming languages.
The openAPI specification and documentation can be viewed in the browser. Start SIRIUS, check which port the service is running
on by clicking the “settings” button and open http://localhost:8080/, where 8080 is replaced with your port.
SIRIUS may be using a different available port. Please check the command line output of the starting SIRIUS: SIRIUS Service is running on port: [PORT_NUMBER].
The page should look something like this:
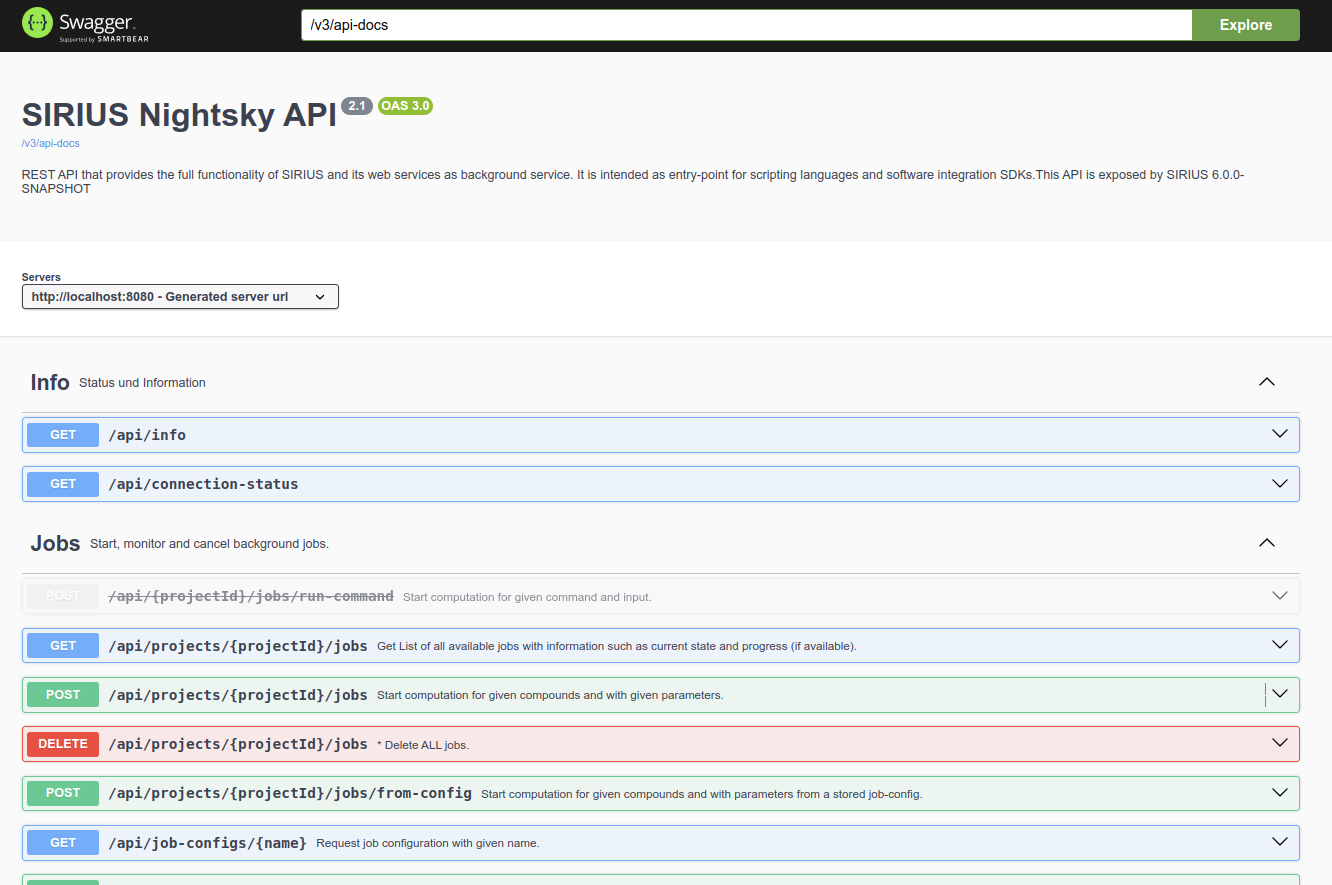
Because there are so many endpoints, getting started can be a bit overwhelming. The following explanations will help you get an overview and get the most out of the API.
Hello world structure candidates (your first tiny example)
First of all, remember that the API supports multiple SIRIUS projects. Therefore, you must always specify the projectId when you want to query a feature.
Say you want to get the structure hits for the feature with named InterestingCompound12. You need to do the following.
(Note: This can be done directly from the Swagger UI at http://localhost:8080/. Please remember to change the commands matching to your query IDs.)
- Get the list of open project spaces:
http://localhost:8080/api/projects
[
  {
    "projectId": "testdataset",
    "location": "/path/to/testdataset.sirius",
    "description": null,
    "compatible": null,
    "numOfFeatures": null,
    "numOfCompounds": null,
    "numOfBytes": null
  }
]
- Get the list of features:
http://localhost:8080/api/projects/testdataset/aligned-features
[
...
  {
    "alignedFeatureId": "577173392664996156",
    "name": "InterestingCompound11",
    "ionMass": 212.1184774810981,
    "adduct": "[M + ?]+",
    "rtStartSeconds": 478.891,
    "rtEndSeconds": 487.677,
    "computing": false
  },
  {
    "alignedFeatureId": "577173392774048066",
    "name": "InterestingCompound12",
    "ionMass": 461.3699477422347,
    "adduct": "[M + ?]+",
    "rtStartSeconds": 447.536,
    "rtEndSeconds": 456.591,
    "computing": false
  },
...
]
- Search for the feature with name
InterestingCompound12and select itsalignedFeatureId. - Get all structure candidates ranked by
csiScore:http://localhost:8080/api/projects/s6tomatoSmall/aligned-features/577173392774048066/db-structures
[
  {
    "inchiKey": "PPYOSYACEILSKE",
    "smiles": "CCCCCCCCC=CCCCCCCCC(=O)NCCCCC(C(=O)O)N(C)C",
    "structureName": "N2,N2-Dimethyl-N6-[(9Z)-1-oxo-9-octadecen-1-yl]lysine",
    "xlogP": 5.5,
    "csiScore": -198.4107988137411,
    "tanimotoSimilarity": 0.4523809523809524,
    "mcesDistToTopHit": 0,
    "molecularFormula": "C26H50N2O3",
    "adduct": "[M + Na]+",
    "formulaId": "577178082920468525"
  },
  {
    "inchiKey": "URAUKAJXWWFQSU",
    "smiles": "C1CCC(CC1)N(C2CCCCC2)C(=O)COCC(=O)N(C3CCCCC3)C4CCCCC4",
    "structureName": "N,N,N',N'-Tetracyclohexyl-3-oxapentanediamide",
    "xlogP": 6.4,
    "csiScore": -217.50017505980176,
    "tanimotoSimilarity": 0.31736526946107785,
    "mcesDistToTopHit": "Infinity",
    "molecularFormula": "C28H48N2O3",
    "adduct": "[M + H]+",
    "formulaId": "577178082920468526"
  },
...
]
Class hierarchy
The main classes in the hierarchy are projects, alignedFeatures and formulas. These have a one-to-many relation.
See below an exemplary representation.
project [projectId:1]
│   ...
│   ...
│
└───alignedFeature [alignedFeatureId:577173392774048066]
│   │   ms-data
│   │   spectral-library-matches
│   │   db-structures
│   │   denovo-structures
│   │
│   └───formula [formulaId:577178082920468525]
│   │   │   isotope-pattern
│   │   │   fragtree
│   │   │   fingerprint
│   │   │   lipid-annotation
│   │   │   canopus-prediction
│   │   │   best-compound-classes
│   │   │   db-structures
│   │   │   denovo-structures
│   │
│   └───formula [formulaId:577178082920468526]
│   │   │   isotope-pattern
│   │   │   ...
│
└───alignedFeature [alignedFeatureId:577173392664996156]
│   │   ms-data
│   │   ...
│
project [projectId:2]
│   ...
│   ...
Within these classes you can find data and results. Results such as structures are long lists and therefore also come with a ‘paged’-endpoint (/page).
With this hierarchy in mind, you can for example:
- select all formula candidates of a feature:
/api/projects/{projectId}/aligned-features/{alignedFeatureId}/formulas - select all (database) structure candidates of a feature:
/api/projects/{projectId}/aligned-features/{alignedFeatureId}/db-structures - select all (de novo) structure candidates of a specific molecular formula candidate of a feature:
/api/projects/{projectId}/aligned-features/{alignedFeatureId}/formulas/{formulaId}/denovo-structures - select the molecular fingerprint of a specific molecular formula candidate of a feature:
/api/projects/{projectId}/aligned-features/{alignedFeatureId}/formulas/{formulaId}/fingerprint