Overview
SIRIUS 6 comes equipped with a comprehensive Graphical User Interface. Upon launching the application, the Welcome Screen serves as the central hub for account management, network status monitoring, and learning resources.
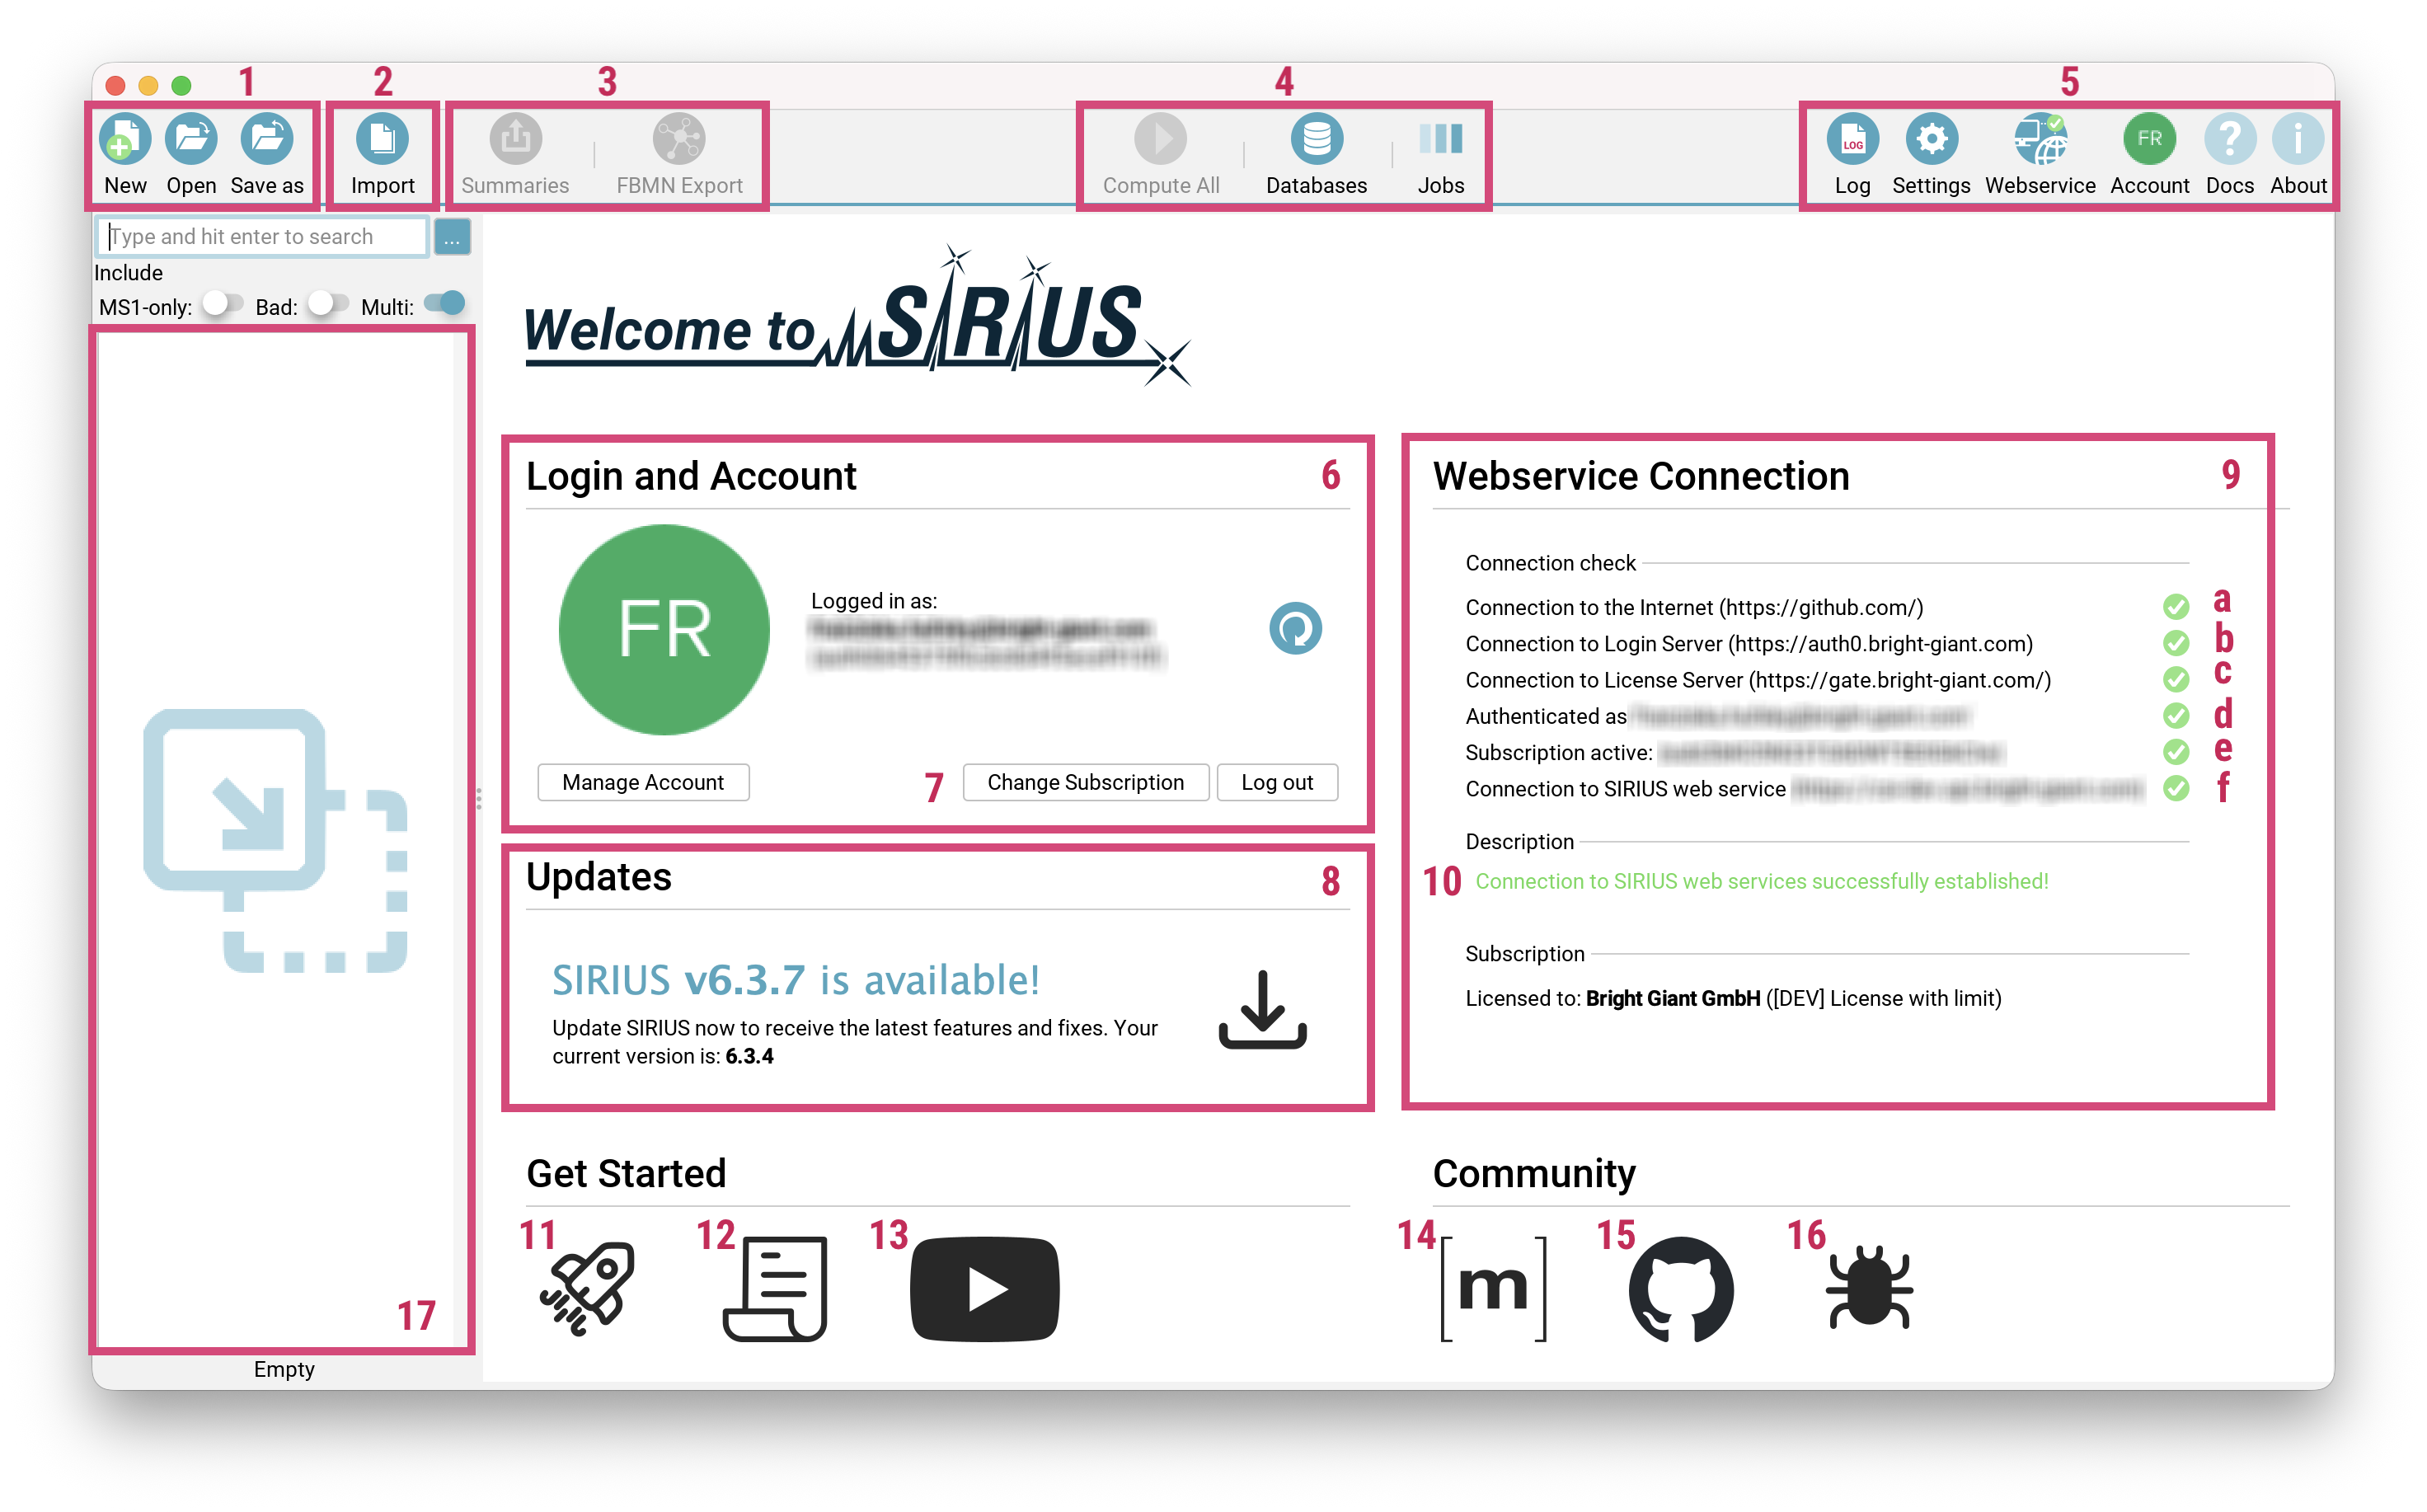
The toolbar [1-5] at the top of the screen provides quick access to the essential tools:
The first button group [1] on the left is for managing your project spaces, including creating, opening and saving them.
The second button group [2] facilitates
importing single features or data containing multiple features into
your project space. The third button group [3] handles exporting data, e.g. for GNPS FBMN analysis
or generating project space summaries.
The fourth button group [4] is dedicated to computations, including starting the computations, getting the job view and importing custom databases. The last button group on the right [5] provides access to the log, settings, webservice information, and account details. Here you can also find a link to the online documentation (Help) as well as information on software licence and related publications (About).
Account creation and login
To access the full capabilities of SIRIUS, you must log into your SIRIUS account or create a new one. This can be done via the Login and Account section on the Welcome Screen [6] or by clicking the Account button in the top-right button group [5].
click Create Account to get to our user portal and create an account. After logging into the user portal, you can request a license. In the SIRIUS GUI, click Log in to enter your account credentials and login.
If you hold multiple licenses, you can switch your active subscription using the Change Subscription button [7]. Once authenticated, SIRIUS establishes a connection to the update server and will notify you if a newer version of the software is available [8].
Before logging in, the Webservice Connection [9] is restricted. The Description field [10] details the specific reason for any connection limitations.
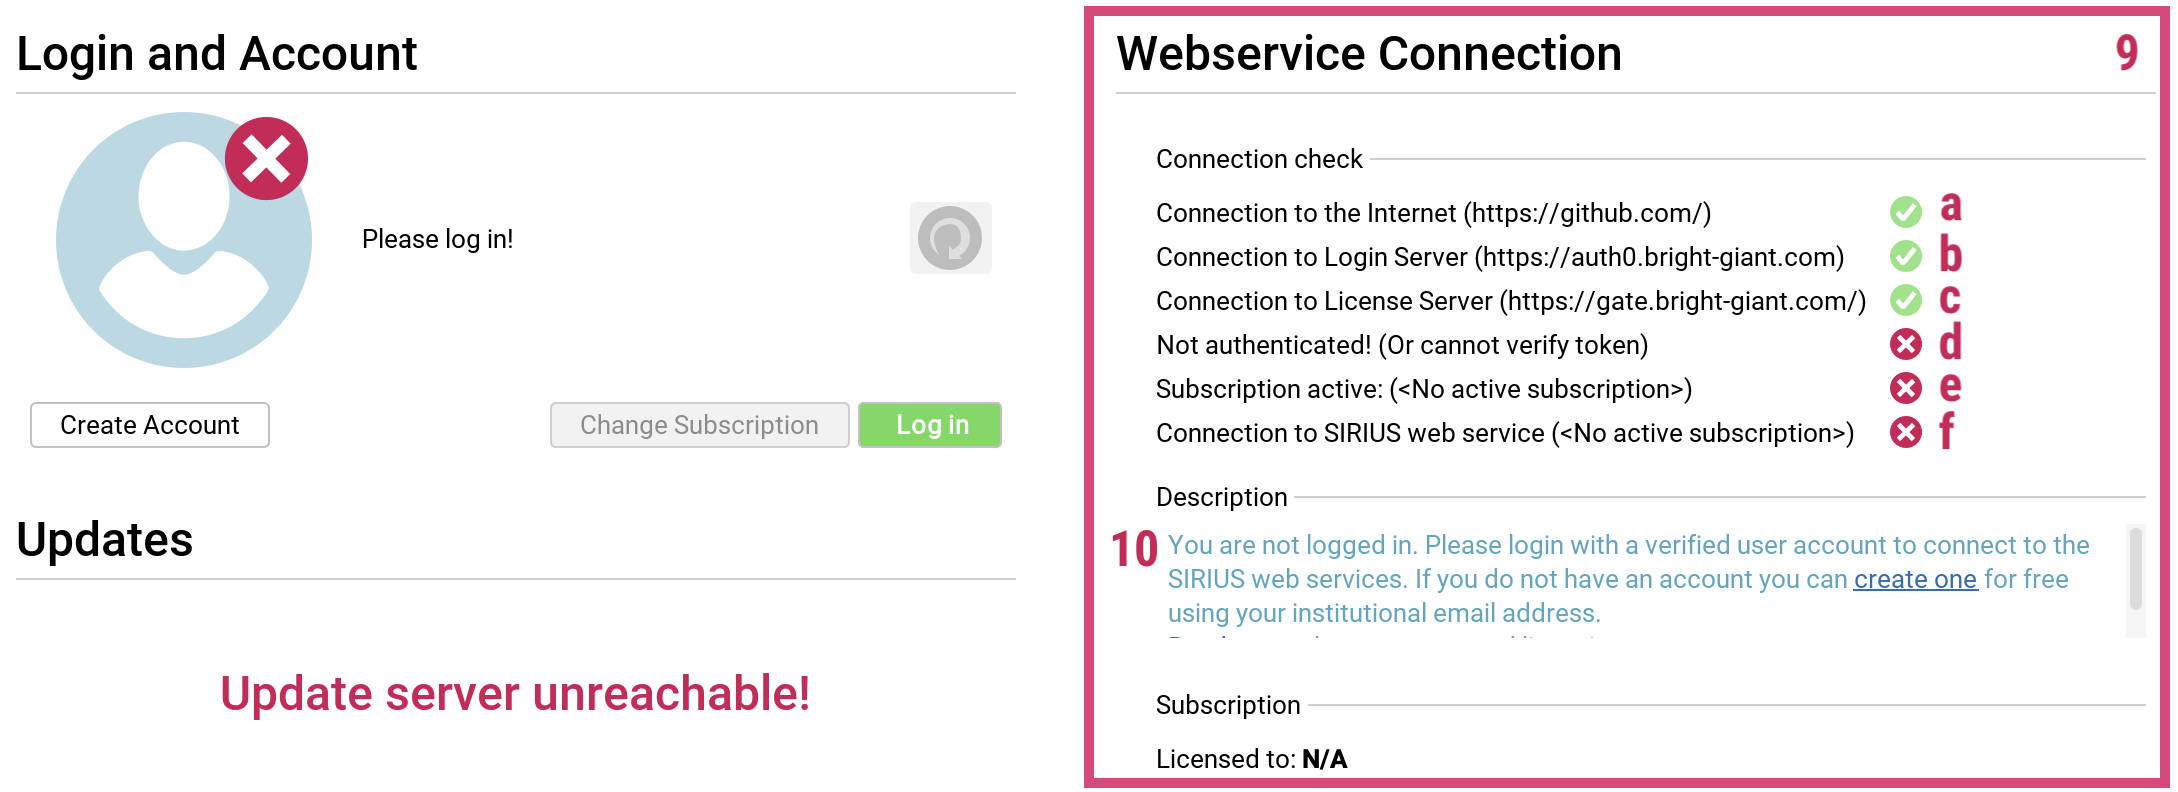
Once you log in, the application performs a comprehensive diagnostic check. A green indicator confirms that the connection is fully established and that SIRIUS is ready for use. This process verifies if basic internet access is available from within the application [a], if the login [b] and license servers [c] are reachable, if your user account is successfully authenticated [d], if a valid license or subscription is active [e], and finally if the connection to the SIRUS web service is established [f].
The Welcome Screen also provides direct access to external resources to help you resolve issues and optimize your workflow:
- Quick-Start Guide: A brief introduction to guide your first analysis.
- Online Documentation: The comprehensive user manual for detailed feature explanations.
- Video Tutorials: Step-by-step instructional videos hosted on YouTube.
- Matrix Community: A chat-based platform for peer support and discussion with the community and developers.
- GitHub Repository: The open-source code repository hosting the project.
- Bug Reports: The official way to submit issues or feature requests.
To import you data, use Import button [2] or drag and drop your data to the feature list [17] on the left. After import or after loading a previously saved project space [1], the welcome screen will disappear and the main application window with the various result views will open up.
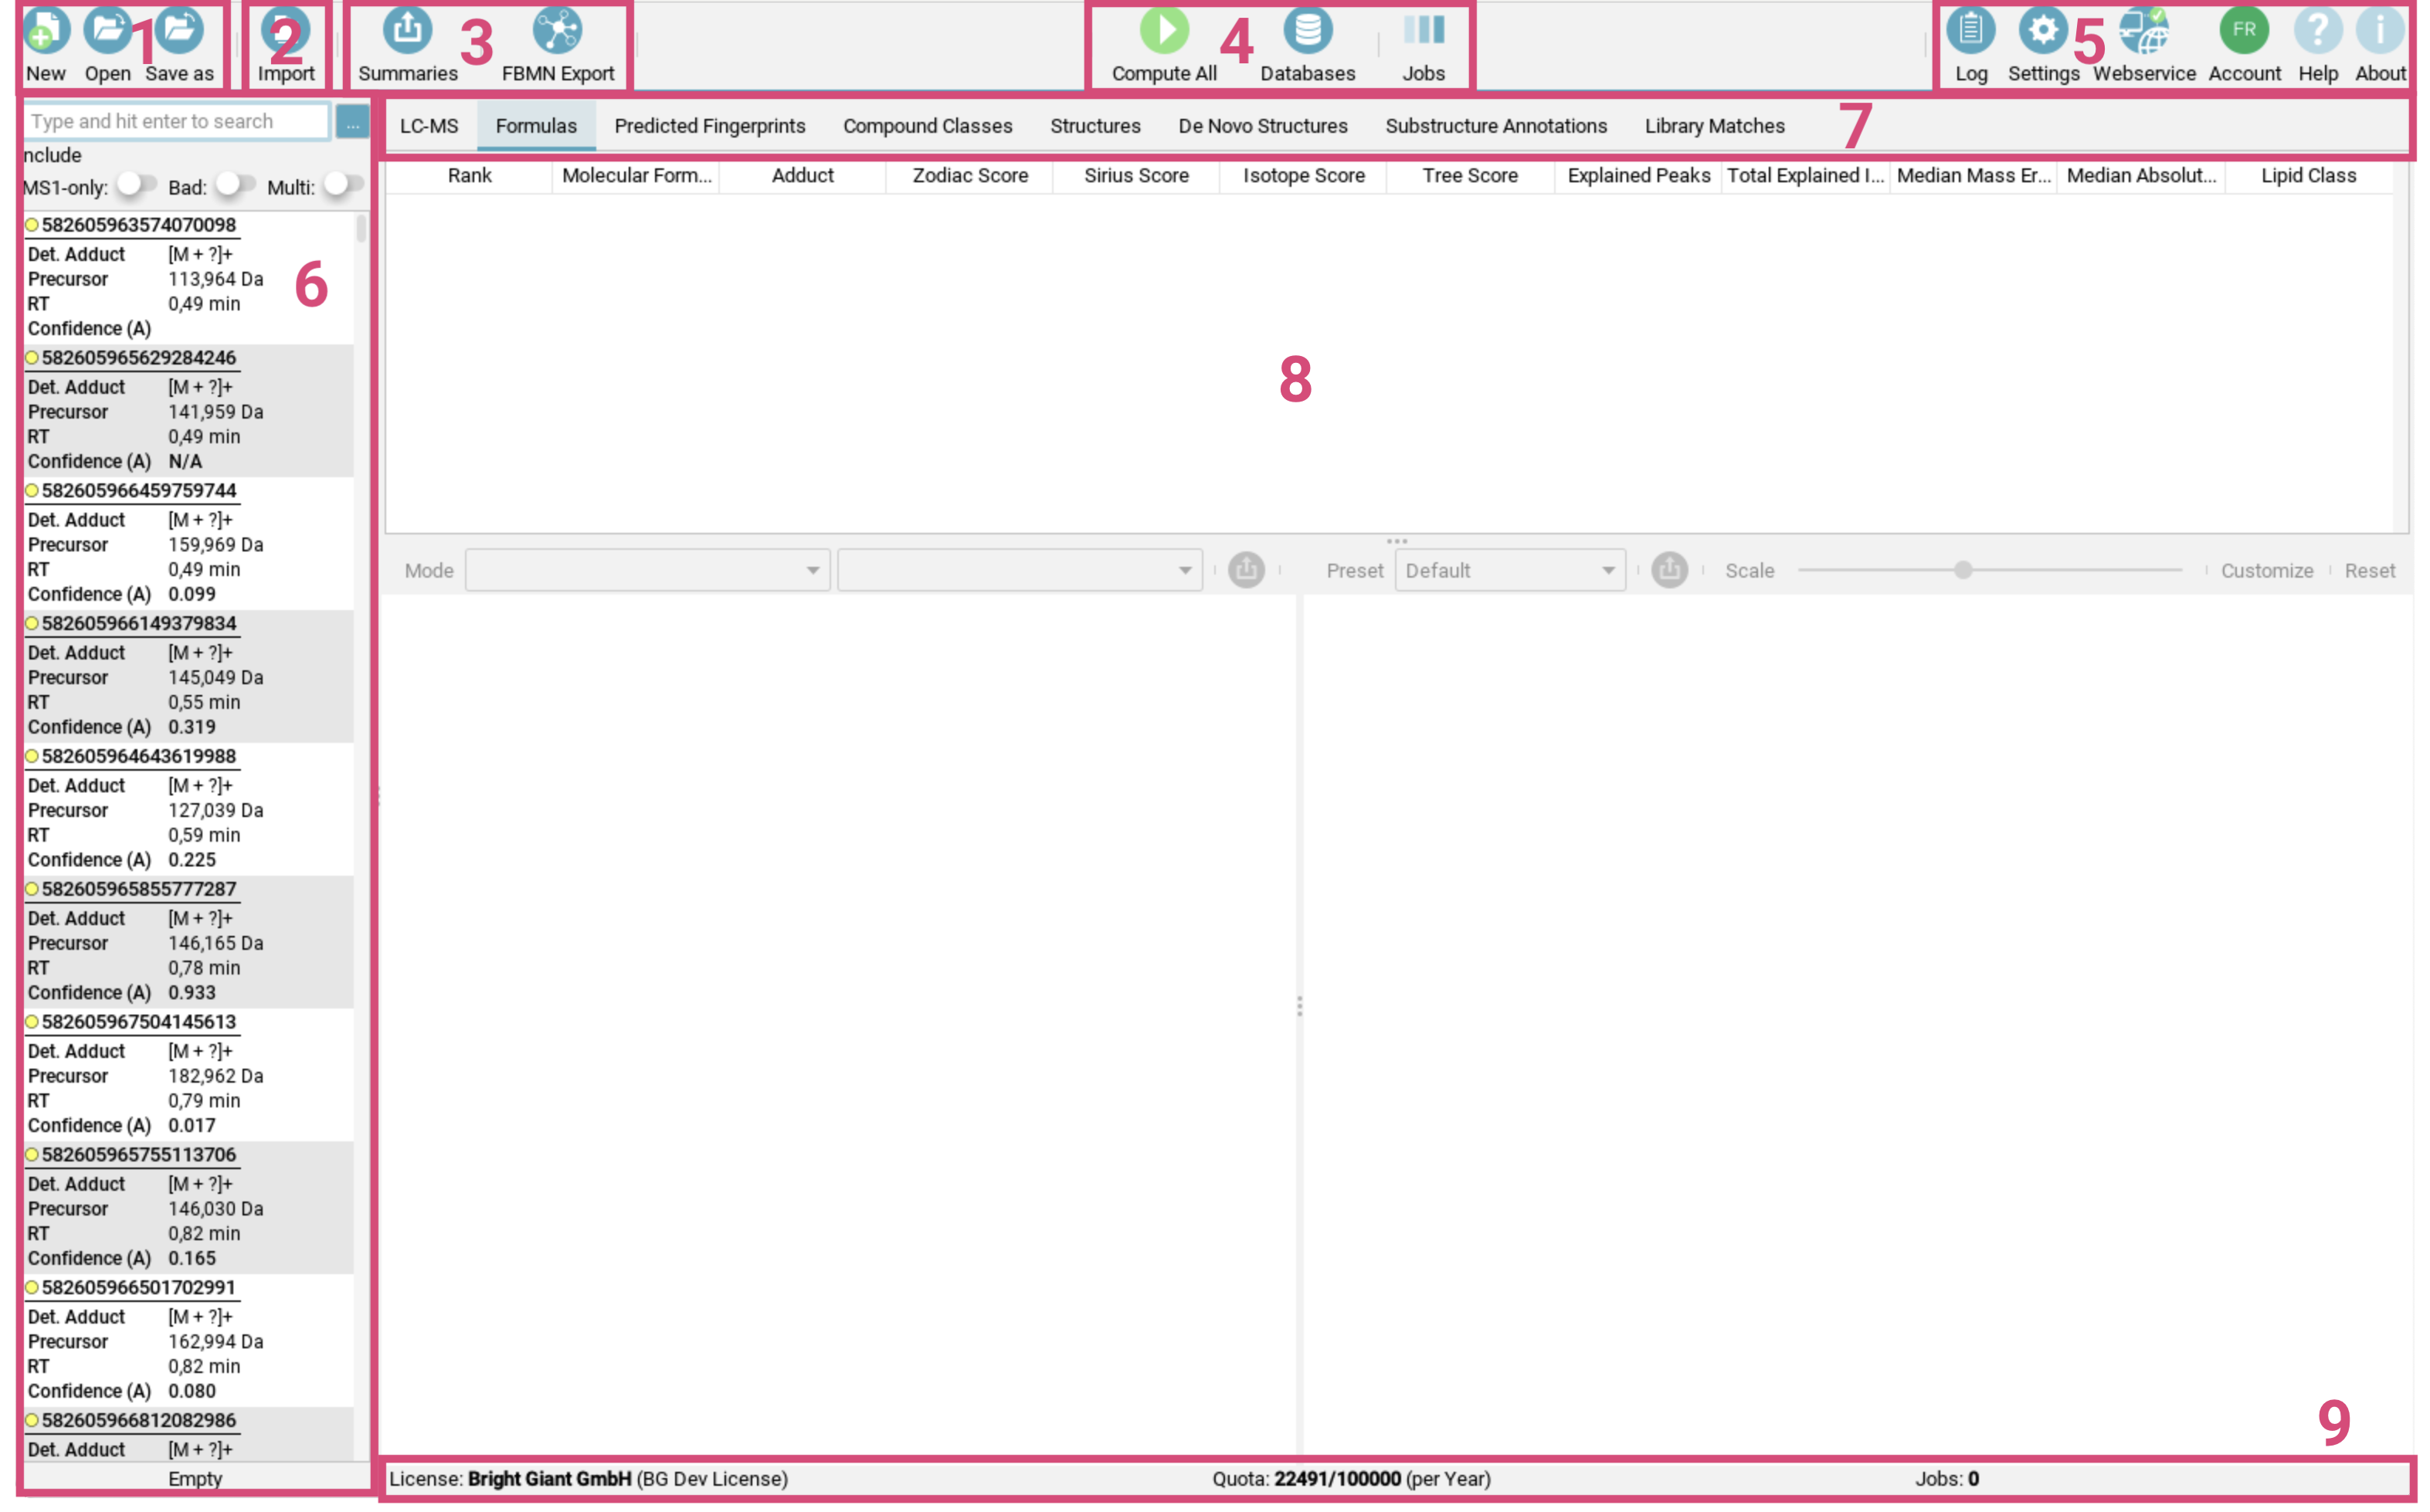
Here’s a breakdown of the main application window components and their functions.
-
The feature list [17] on the left side contains all imported (aligned) features. A feature contains all MS and MS/MS spectra corresponding to a measured aligned feature. For each feature, adduct type, precursor mass, retention time and confidence score (if computed) are shown in this panel.
Confidence (A)is the approximate confidence mode, andConfidence (E)the exact confidence mode. -
The result view [18] is displayed to the right of the feature list and allows users to examine different result views. The tab selector [19] at the top of this panel lets you switch between these views, offering various perspectives on your data.
-
The bottom information bar [20] provides details about your license status for the webservice-based structure elucidation tools, the number of computed features and feature limits.
For a quick start, you can also watch our SIRIUS Short Course Tutorial Series introducing basic elements and functionality of the SIRIUS 6 GUI.
Data import
You can import .ms, .mgf, Agilent’s .cef, .mzml and .mzxml files using the Import button or by drag-and-drop.
SIRIUS will automatically extract all relevant attributes (such as MS level, ionization, and precursor mass)
from the file.
When importing multiple .mzml (or .mzxml) at once, SIRIUS will ask you if it should align them.
When importing a peak list file containing a molecular formula, select Ignore Formulas if you would like to do the molecular formula annotation using SIRIUS.
For more information on supported file formats, refer to the Input section and watch the Tutorial on Data Import & Preprocessing.
Sort and filter
To sort the feature list, use right-click to open the [sort] dialog below.
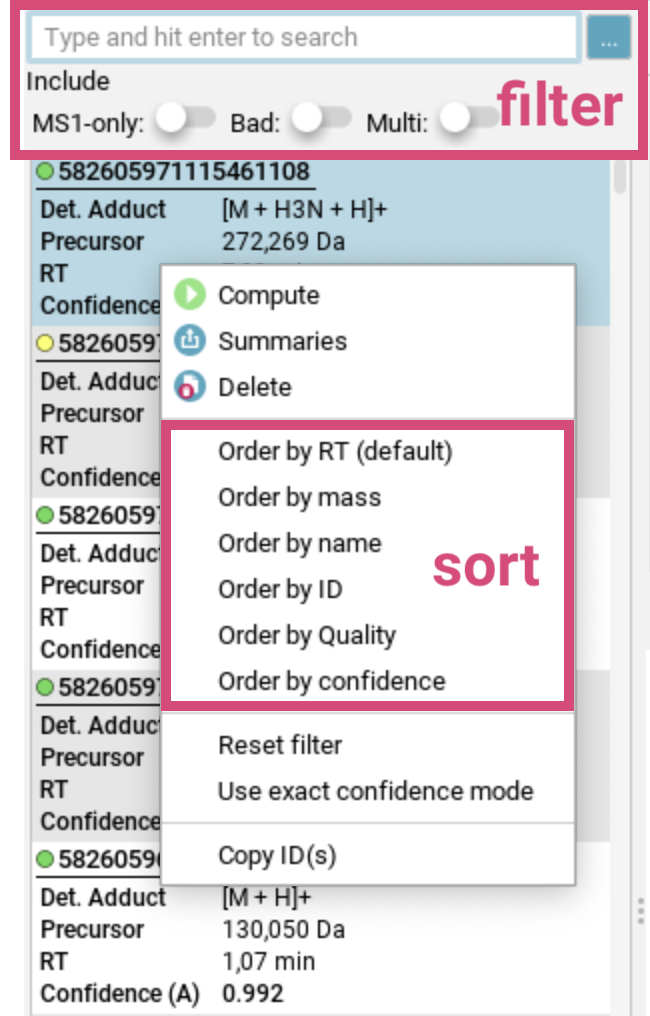
You can sort aligned features by retention time (RT), mass, name, ID or confidence score (if available). At the bottom of this dialog, you can select the confidence mode (approximate or exact) to be displayed and used for sorting. For more details, see the confidence modes section.
The displayed feature list is already filtered by quality, i.e., features containing only MS1 spectra, features with bad quality and multimeric features are hidden. Use the switches on top of the feature list to unhide.
The feature list can further be refined by clicking the filter button (three dots to the right of the search field) to open the filter dialog:
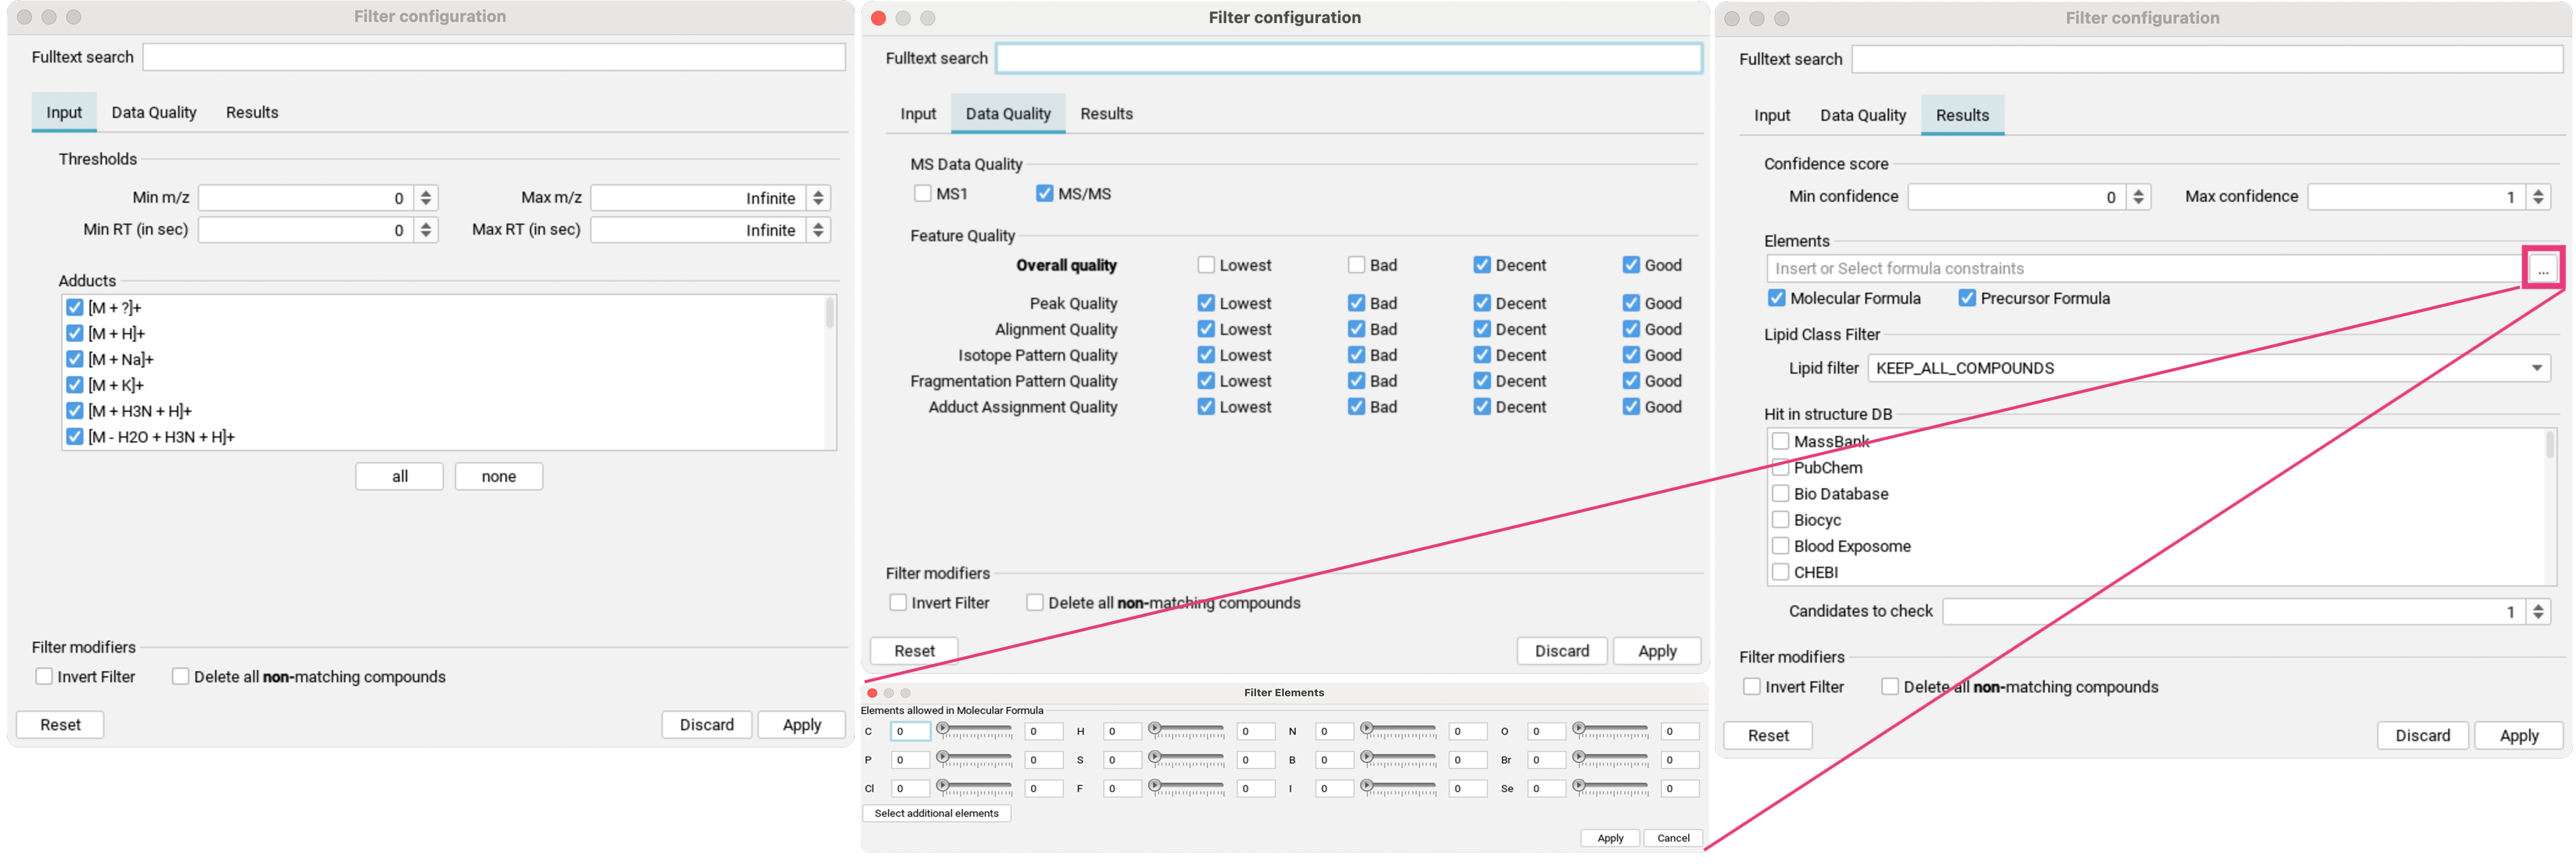
- In the
Inputtab [1], aligned features can be filtered by mass range and retention time range, as well as by specific detected adducts. - In the
Data Qualitytab [2], you can refine the preset quality filter. - In the
Resultstab [3], you can filter for confidence score range, specific element constraints in either the neutral molecular formula or precursor formula, as well as by detected lipid classes. If structure database results are available, you can filter for hits in specific structure databases.Candidates to checkallows you to specify the number of top candidates to consider.
For all filters, you can also choose to invert the filter, and whether you want to delete all non-matching compounds.
Custom structure databases
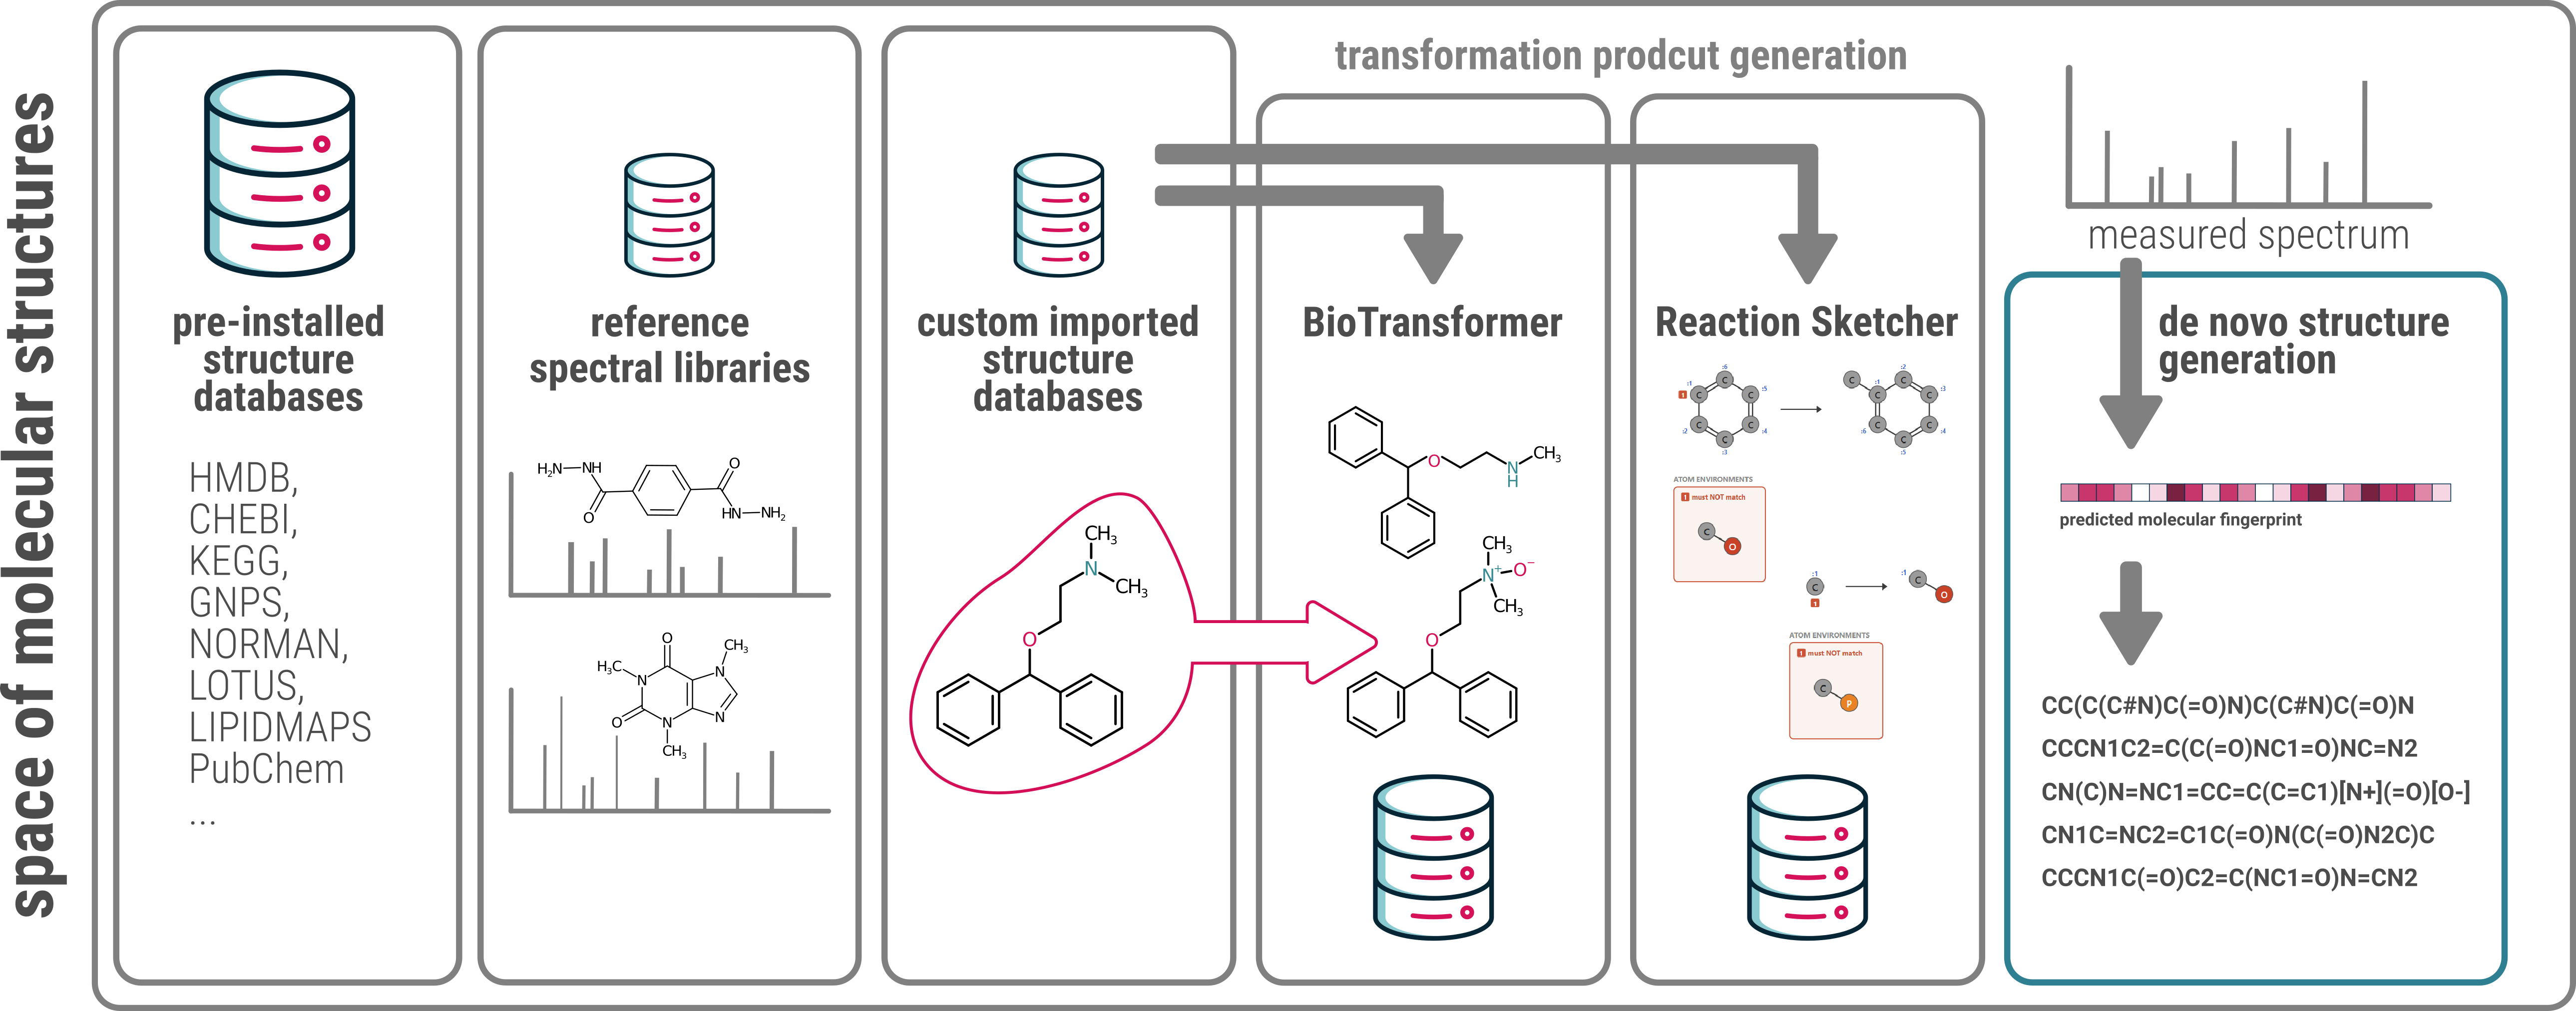
You can extend the search space beyond standard, public molecular structure databases or tailor the search space to individual research needs, isolate specific biological contexts, or even explore entirely novel chemical spaces. For an individual structure database, you can either
- import a list of custom structures,
- automatically generate bio-transformation products,
- generate transformation products by applying custom reactions,
- or even create candidate structures de novo (from the molecular fingerprint) when dealing with “unknown unknowns” or poorly represented analyte classes.
Import of custom structure databases and spectral libraries
Custom structure databases and spectral libraries can be added via the Databases dialog, accessible via the
top center of the GUI ribbon. SIRIUS allows you to import custom structure databases and spectral libraries. Any spectral library you import also functions as a structure database. Learn more about custom database import and supported file formats here.
Custom databases are stored as files with the .siriusdb extension.
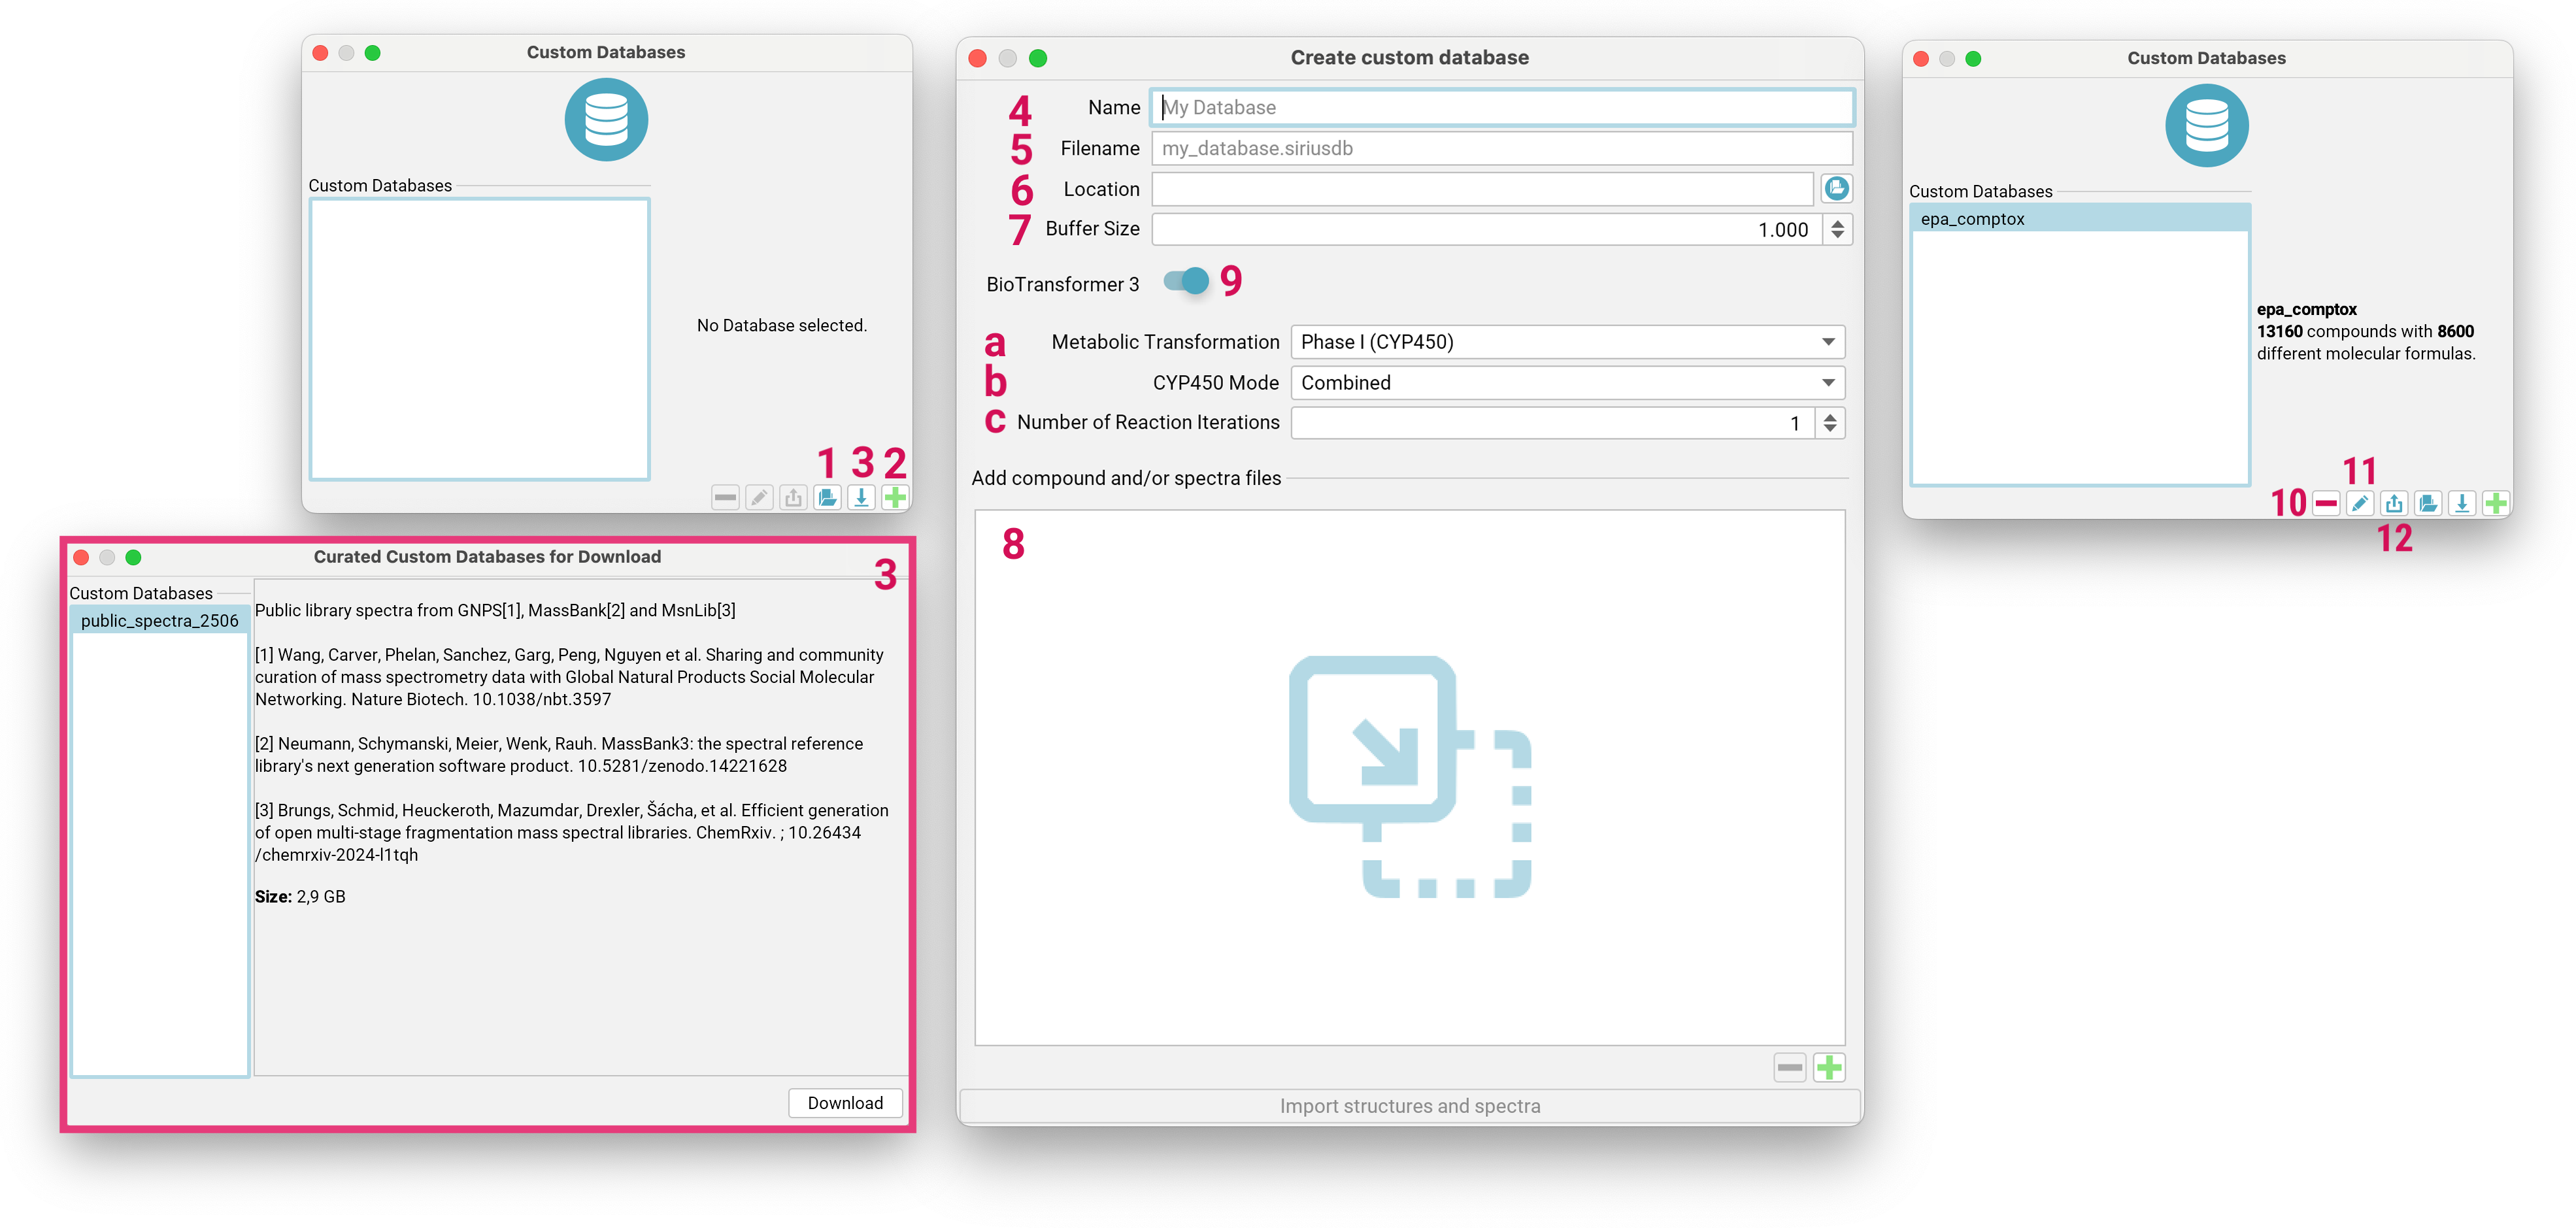
If you already have a database with this format on your local machine, you can add it to SIRIUS by clicking the
Add existing Database button [1] on the bottom right. To create a new custom database,
click the Create custom Database button [2].
You can also download a curated spectral database [3] with public spectra from GNPS, MassBank and MsnLib for spectral library matching.
To create a custom database, enter a name for the database [4] (maximum length: 15 characters) that is used within SIRIUS.
Specify the file name for the database, ensuring it ends with .siriusdb [5].
Choose a valid, writeable path on your local machine to store the database [6].
Adjust the buffer size [7] to control how many structures or spectra should be kept in memory. This can be increased when importing large files on a faster machine.
Drag and drop files or directories containing structure/spectra files to the input area [8], or use the + button to browse your file system.
Imported databases can be deleted or modified using the - [10] or pencil [11] button, respectively. Databases can also be exported as TSV or SDF files including the generated biotransformations [12] and links to external databases.
Please note that you have to be logged in to your SIRIUS account to import custom databases.
Creating bio-transformations
SIRIUS integrates BioTransformer 3.0 [9] (Wishart et al., Nucleic Acids Res, 2022) for generating transformation products. BioTransformer is can be applied to custom structure databases during import. For detailed explanations of all options, please consult the official BioTransformer documentation. Here is only a selection:
Metabolic Transformation[a]: Coverage Options:Phase 1 (CYP450): Focuses on cytochrome P450-mediated transformations.EC-based: Predicts transformations based on Enzyme Commission (EC) numbers.- …
AllHuman: Predicts all possible human metabolites from any applicable reaction (oxidation, reduction, deconjugation) at each step.
Number of Reaction Iterations[c]: allows you to specify the number of transformation steps for the prediction. It is applicable for EC-based, CYP450, Phase II, and Environmental microbial biotransformers. The default value is typically 1.
Reaction Workflows
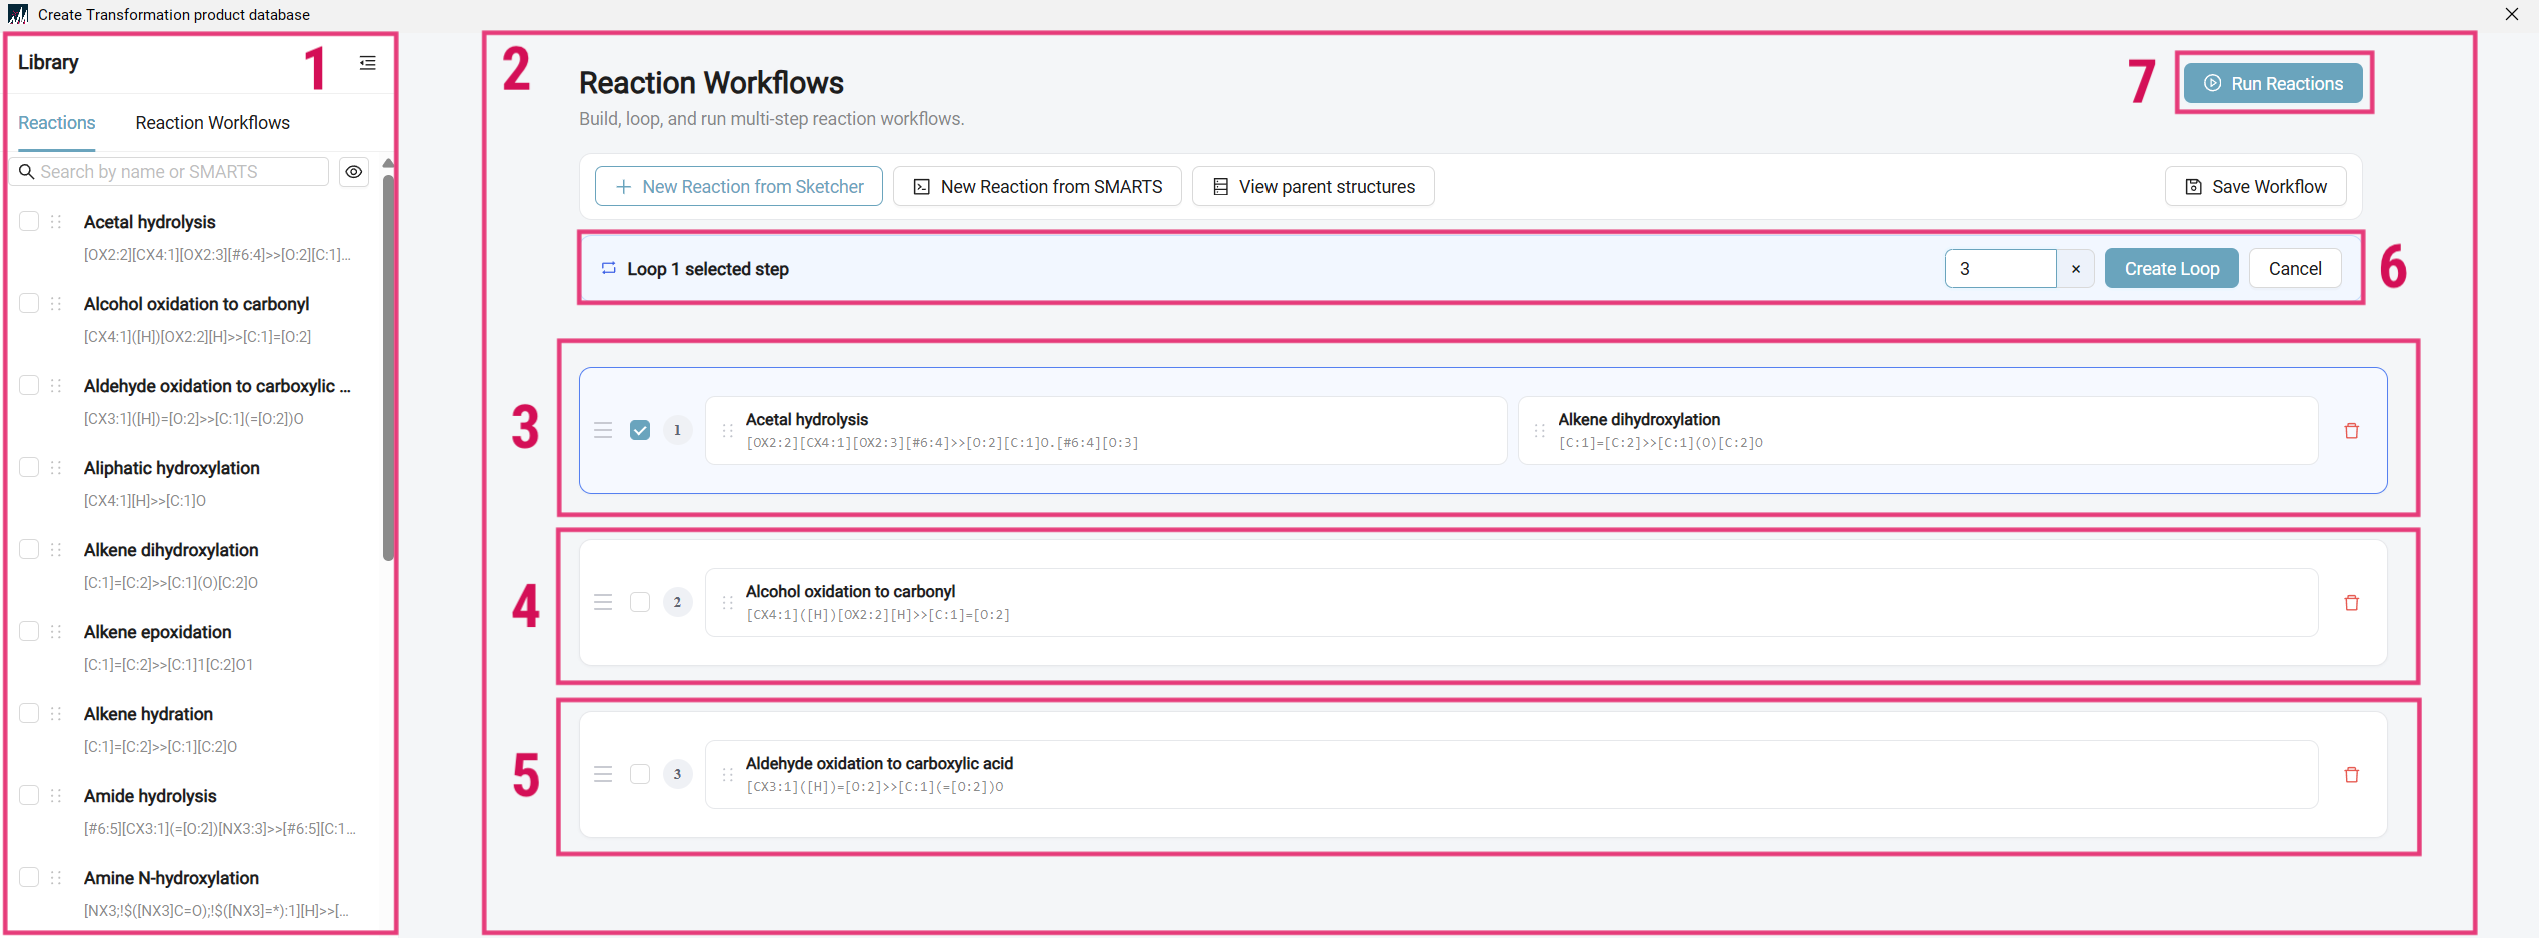
You can define custom chemical reactions and apply them to your custom structure databases. Select an imported custom database and open the Reaction Sketcher (gear symbol). The left panel displays a list of saved reactions [1]. Drag and drop reactions into the central workspace [2] to build a reaction workflow. A reaction workflow consists of sequential rows [3]-[5] that dictate how transformations are applied.
- Row-Level Execution: A single row can contain multiple reactions [3]. The software applies all reactions within a row concurrently to the input structures and saves the resulting transformation products.
- Sequential Processing: Reactions in subsequent rows (e.g., Row 2 [4]) are applied only to the generation of products resulting from the immediate predecessor (e.g., Row 1 [3]) . They are not applied to the original starting structures. Each row’s intermediate products are saved automatically.
- Looped Execution: You can select one or multiple rows to form a loop [3]/[6]. This applies the selected sequence of reactions iteratively a specified number of times before processing moves to the next row. Intermediate transformation products from each row and every iteration of the loop are preserved.
Once your workflow is complete, click Run Reactions [7] to generate the new structures. You must create or specify a new custom structure database to store the results of your reaction workflow.
Be aware that processing can be computationally intensive and may take a long time if applied to a large number of input structures.
The newly created database will automatically become available within SIRIUS and can be selected for structure searches.
Create new reaction from SMARTS
You can define your own chemical reactions using the Reaction Sketcher:
- Define the Reactants: Draw the reactant (educt) side of the reaction [1].
- Specify Atom Constraints: To define specific chemical environments, click
Specify atom constraints[2]. Select a target atom [3], clickModify Atom[4], and draw the surrounding chemical environment [5]. You can add this environment as either a strict restriction or a specific requirement [6]. - Define the Products: Draw the product side to complete the chemical reaction [7].
- Verify SMARTS: Review the final reaction mechanism [8]. You can manually modify the reaction SMARTS string directly in the text field or return to the Sketcher to modify the reaction.
Computing results
SIRIUS offers two computation modes for processing data: Single Computation and Batch Computation. Both computation dialogs are similar in layout and functionality.
-
The Single Computation mode allows you to set different parameters for each individual feature. You can initiate a single computation by right-clicking on a single feature and selecting
Computein the context menu or by double-clicking on the feature. When opening the dialog, element prediction is performed to preset the chemical alphabet. However, you can change this alphabet in theElement Filterif you like. -
For Batch Computation you can right-click on multiple selected features and choose
Computeto process them collectively. Alternatively, you can use theCompute Allbutton in the toolbar to compute all features in the project space. Here, you can use theElement Filterto choose the elements that should automatically be detected for each feature. Additionally, you can choose whether to recompute and override results for features that have already been analyzed.
The following section provides a detailed explanation of the compute dialog, using the Batch Computation dialog as example.
Compute dialog
Starting with SIRIUS 6, the compute dialog has been streamlined to improve clarity by displaying only those settings that are essential for any type of analysis. For a video Tutorial, click here.
Use the Advanced settings toggle switch at the top [1]
to include additional settings that are relevant for specific use cases or to set limits for computation times.
The compute dialog is divided into global settings [2] and settings for the following subtools:
- Spectral Library Search [3]
- SIRIUS - Molecular Formula Annotation [4],
- ZODIAC - Network-based Molecular Formula Re-ranking [5],
- CSI:FingerID - Fingerprint Prediction & CANOPUS - Compound Class Prediction [6],
- CSI:FingerID - Structure Database Search [7] and
- MSNovelist - De Novo Structure Generation [8].
Databases are selected as part of the global settings to ensure consistency throughout the identification workflow.
As of SIRIUS 6, CANOPUS is automatically executed together with the fingerprint prediction.
Subtools can be selected individually or combined, but note that the selection must align with a valid SIRIUS workflow.
For example, you cannot search structure databases without predicting fingerprints first.
Subtools are automatically enabled/disabled to match the workflow principles.
You can manually force to override automatic tool selection if you already have intermediate results and wish to avoid redundant re-computation of computationally intensive jobs. You will receive a warning if subsequent tools are affected.
 ZODIAC will only be displayed if a sufficient number of features with MS/MS spectra have been selected.
If the Recompute already computed tasks? checkbox [9] is checked,
all previously existing results for the selected features in the current project space will be invalidated and overwritten to execute the newly selected workflow.
Additional parameters for specific subtools can be displayed using the Advanced settings toggle switch at the top [1].
To export your selected parameters to the CLI or the API use the Show Command and Show JSON button at the bottom [10].
You can save your computation setup as a preset to reload for the next computation [11].
Computation will start after pressing the Compute button on the bottom right [12].
Computation presets
You can save your computation parameters in the compute dialog as a preset to reload for the next computation. For editing, you can access the computation presets also via the settings dialog.
Three predefined presets are available, which can be loaded, customized, and saved as personalized computation workflows (note that the predefined presets themselves cannot be edited):
Default: This workflow is recommended for general applications. It includes molecular formula annotation, fingerprint prediction, compound class prediction, and structure database search. Molecular formula annotation is performed using theDe novo + bottom-upapproach for comprehensive results.DB-Search: Designed for users focused solely on structure database hits, this preset greatly reduces the computational effort of molecular formula annotation. Molecular formula annotation only considers formulas contained in databases, with biomolecule structure databases selected by default. Note that confidence scores may be less reliable in this preset due to the absence of the full range of de novo candidates for comparison.MS1: Specifically for MS1-only data, this preset supports molecular formula annotation exclusively. The De novo approach is recommended here to limit bias by considering all potential candidates.
Learn more about molecular formula identification with SIRIUS.
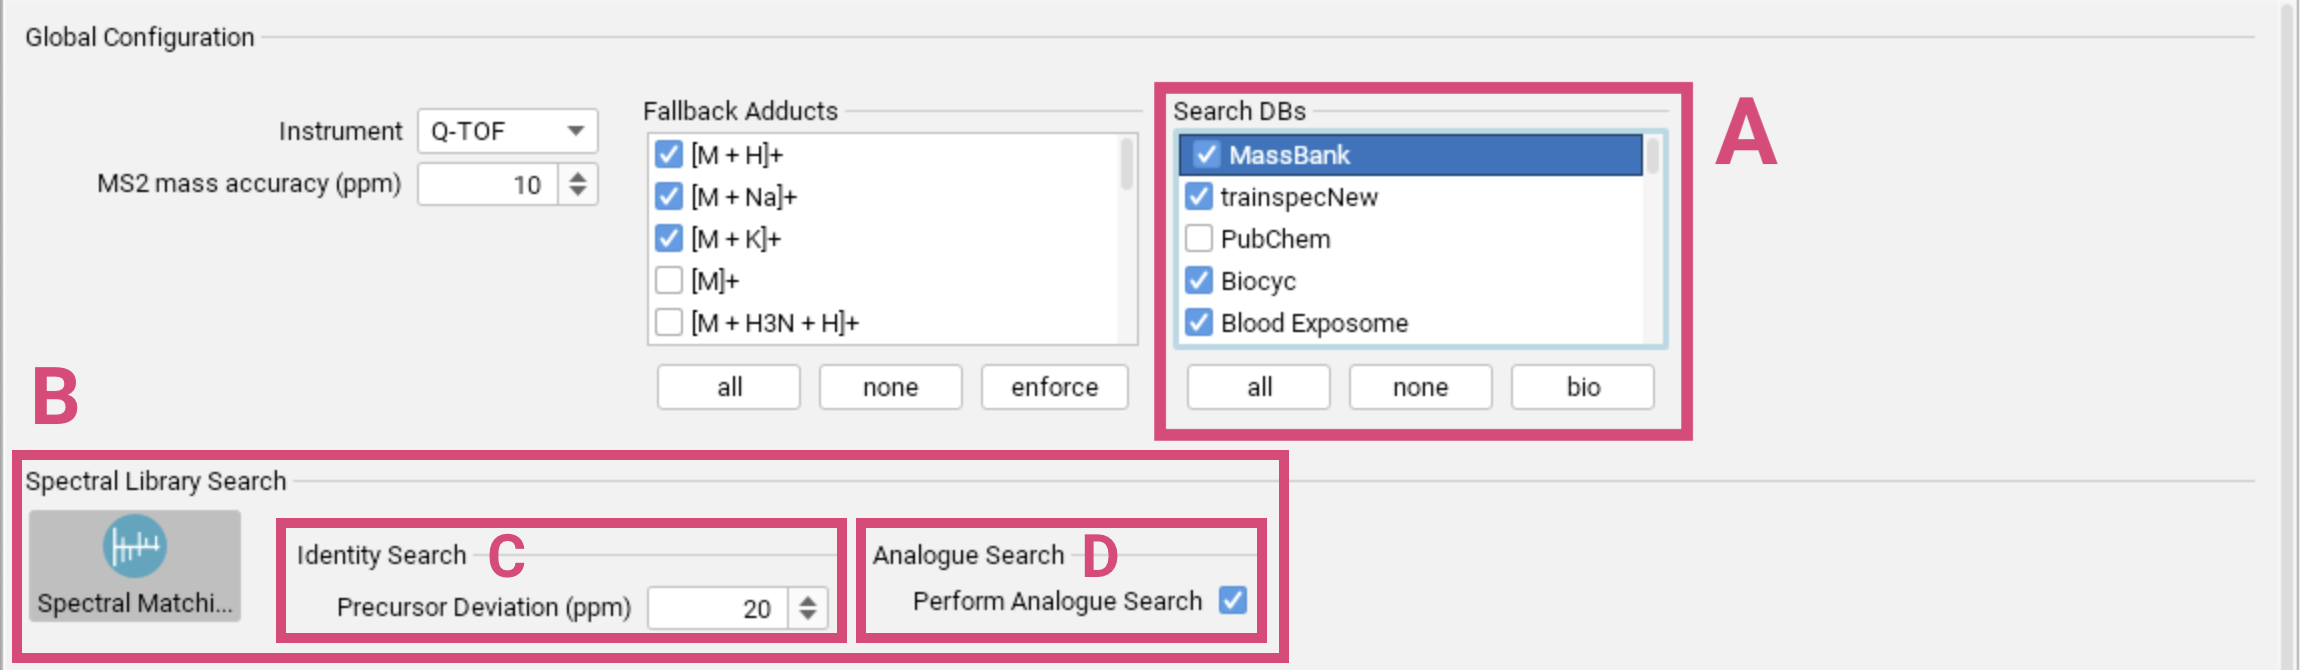
Global Configuration
Set the general parameters that define the characteristics of your mass spectrometry data, particularly concerning the instrument used and the expected mass accuracy [A]. In the Instrument field, you can choose Q-TOF, Orbitrap or FT-ICR.
The choice of instrument affects only a few parameters,
primarily the allowed mass deviation. If your instrument is not among these options,
select Q-TOF as default. You can change the maximum allowed mass deviation, ensuring that
SIRIUS only considers molecular formulas with mass deviations below
the specified ppm threshold. For masses below 200 Da, the allowed mass deviation is
$(200 \cdot \frac{ppm_{max}}{10^6})$.
The set of fallback adducts [B] will be used for all features for which no adducts were detected during preprocessing (or prior external annotation). Using the enforce option, you can even enforce to consider the selected adducts for all features (in addition to the detected adducts). The “base ionization” of the detected adduct will be considered by default. Refrain from selecting all adducts as fallback adducts, as multiple testing inflates the chance of errors. Learn more about adduct handling here.
In the compute dialog for a single compound, the adduct selection is different (set of possible adducts). The detected adducts (or SIRIUS default adducts) are pre-selected. Select the adducts you want to be considered for computation and deselect the adducts you not want to be considered for computation.
Databases [C] are selected as part of the global settings to ensure consistency throughout the identification workflow. Imported custom databases are displayed at the top of the list. Per default, the biomolecule structure databases are selected. You can restore this default selection using the bio button.
Spectral library matching
If imported or downloaded spectral libraries are available, select them in the global settings [A]. Spectral Library Search will then automatically be activated in the compute dialog [B]. SIRIUS supports Identity Search [C], meaning that library spectra with the same precursor mass (within a given precursor mass deviation) are matched against the query spectrum, and Analog Search [D], meaning that library spectra with different precursor masses are matched against the query spectrum. For more information, refer to the Spectral library matching section.
Since structure database results depend on the selected molecular formula, SIRIUS ensures that molecular structures with a formula corresponding to a good spectral library hit are considered (even if its molecular formula receives a low SIRIUS score). That means that molecular structures of well-matching reference spectra are automatically included in the structure database search.
Identifying molecular formulas with SIRIUS
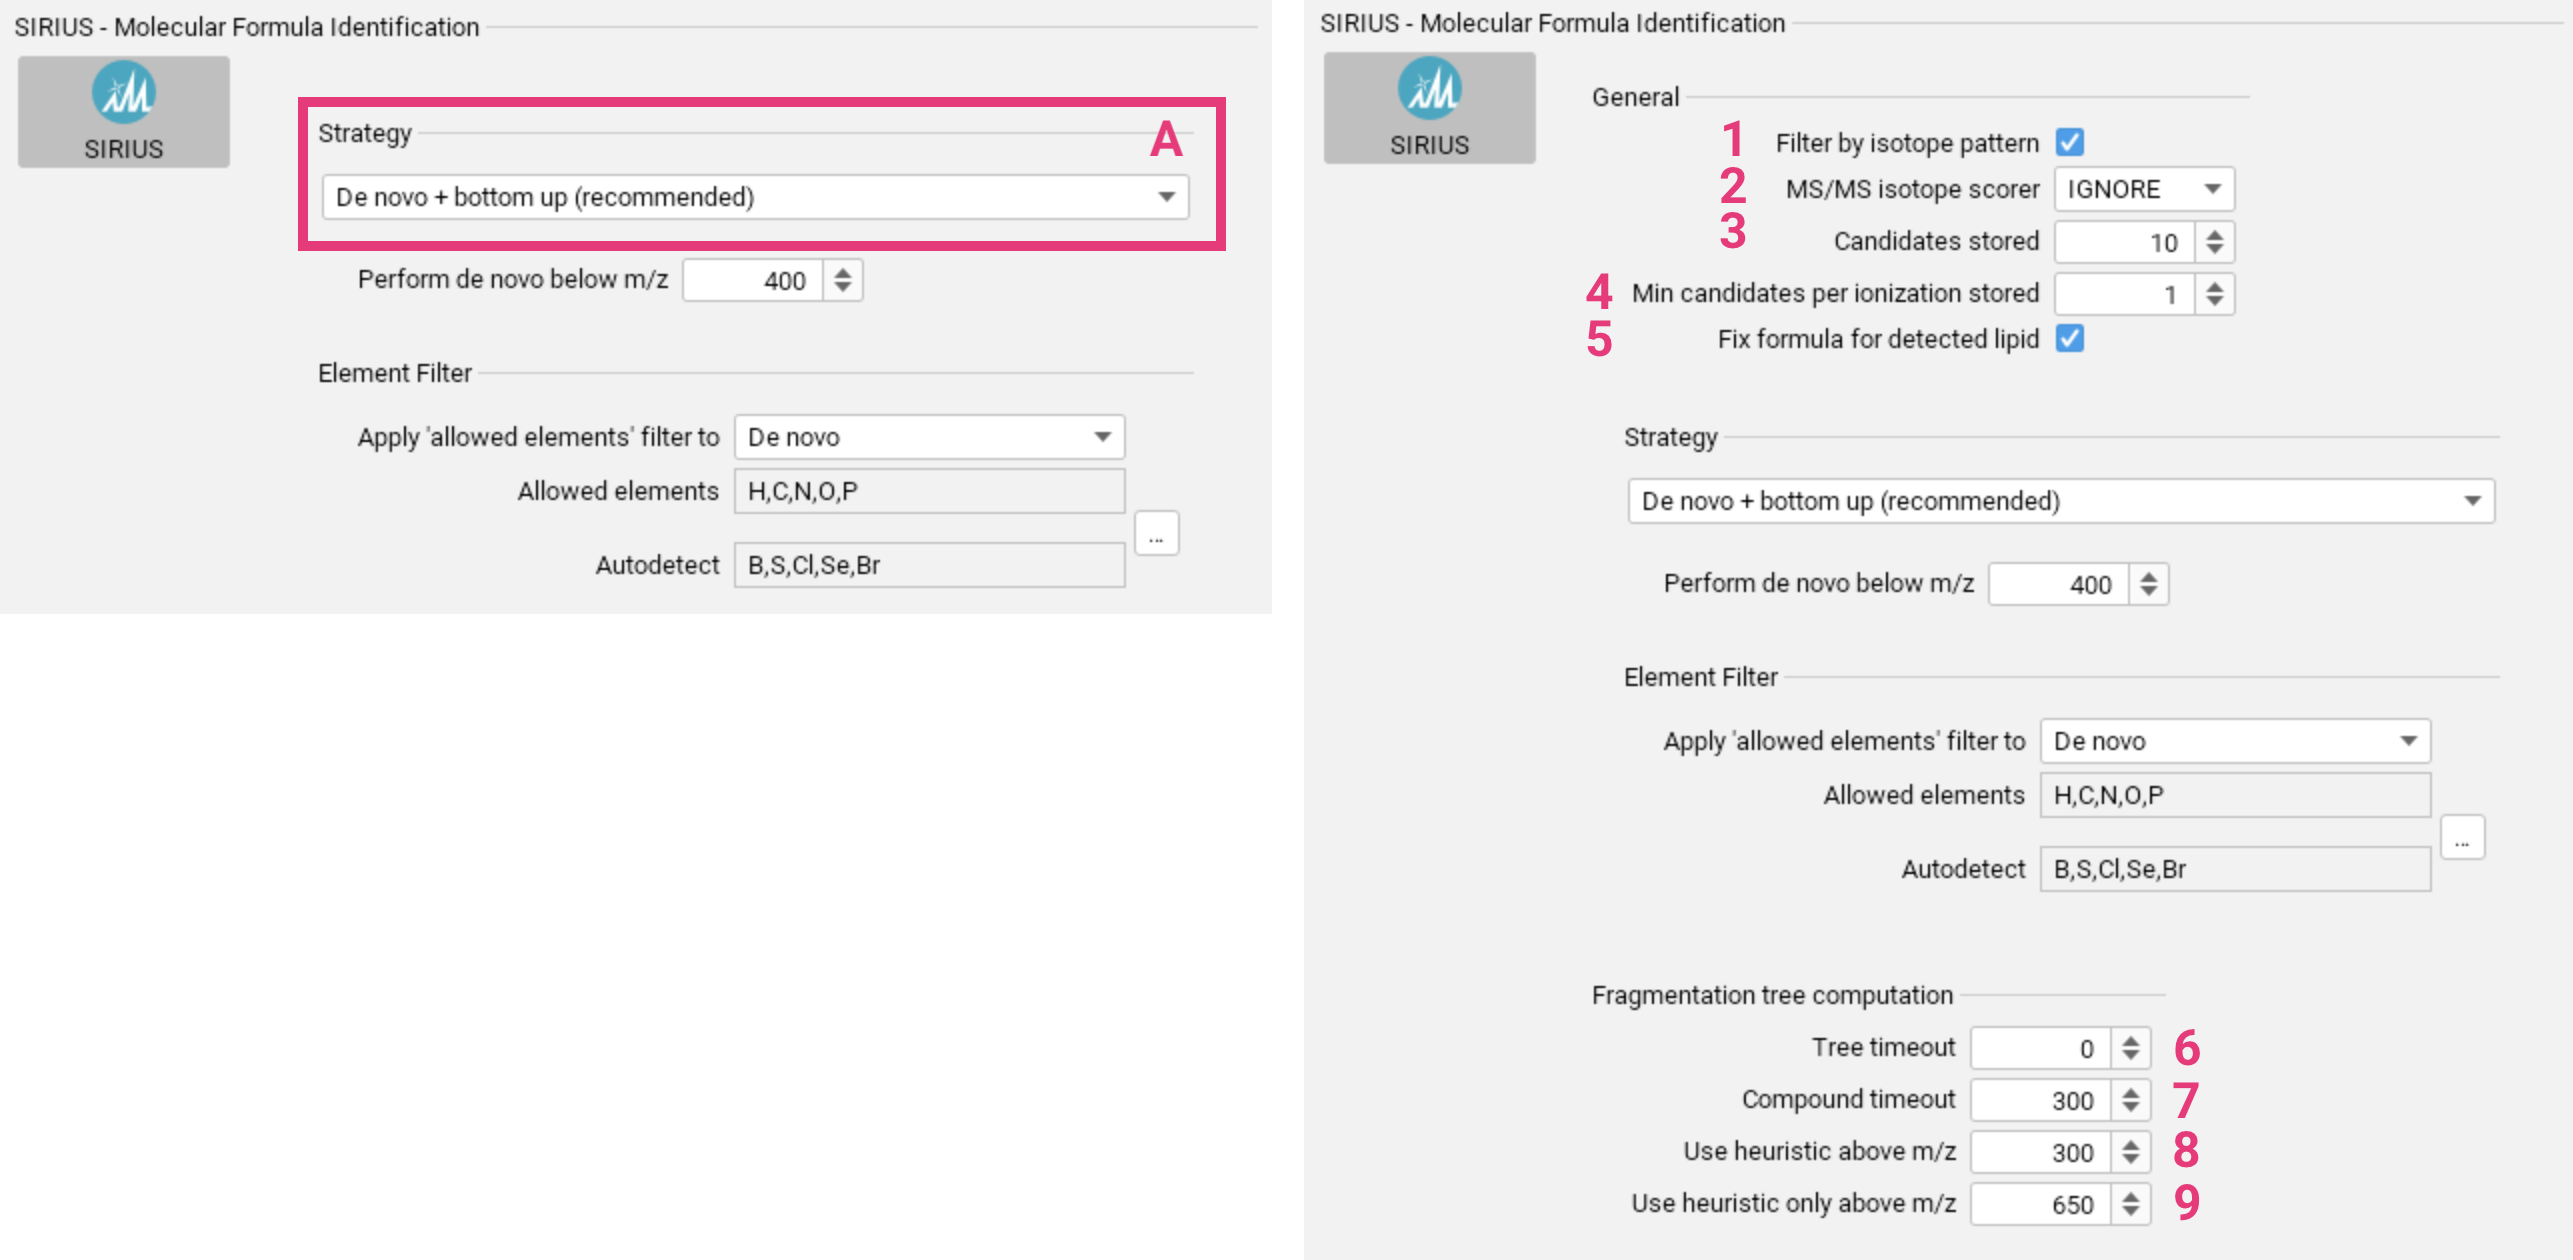
To identify molecular formulas using SIRIUS, choose the appropriate molecular formula annotation strategy [A]. This is crucial for a successful SIRIUS analysis, as it will significantly impact subsequent steps. Parameters for the different strategies are explained below. Before selecting a strategy, it is important to understand the differences between the molecular formula annotation strategies to choose the most appropriate one for your analysis. For a video tutorial, click here.
Advanced settings for molecular formula annotation
- By default, molecular formula candidates whose theoretical isotope patterns deviate significantly from the measured isotope pattern are discarded. You can disable this setting [1] if you suspect poor quality isotope patterns in the input data.
- If isotopic peaks are present in the input MS2 spectrum, they can
either be used for scoring (
SCORE) or be ignored (IGNORE) [2]. - You can select the number of molecular formula candidates that will be saved [3].
- Specify the minimum number of molecular formula candidates to store for each ionization state, even if they are not among the top n candidates [4].
- If SIRIUS predicts that the query spectrum may be a lipid, the molecular formula according to that prediction is enforced (default) [5]. If the molecular formula is not in the selected database, it will not be enforced, but will be added as candidate.
- Set a time limit (in seconds) for computing the fragmentation tree for a single molecular formula candidate [6]. Set to 0 to disable the limit.
- Set a total time limit (in seconds) for computing the fragmentation trees for all molecular formula candidates of a feature [7]. Set to 0 to disable the limit.
- For higher mass compounds, SIRIUS can compute fragmentation trees heuristically instead of exactly. This heuristic method can be used to pre-rank molecular formula candidates, with exact trees computed only for the top candidates. Set the m/z value above which this approach will be applied [8].
- For very high masses, exact solutions may be impractical, and only heuristic trees should be computed. Set the m/z value above which trees will exclusively be computed using the heuristic [9].
Molecular formula annotation strategies
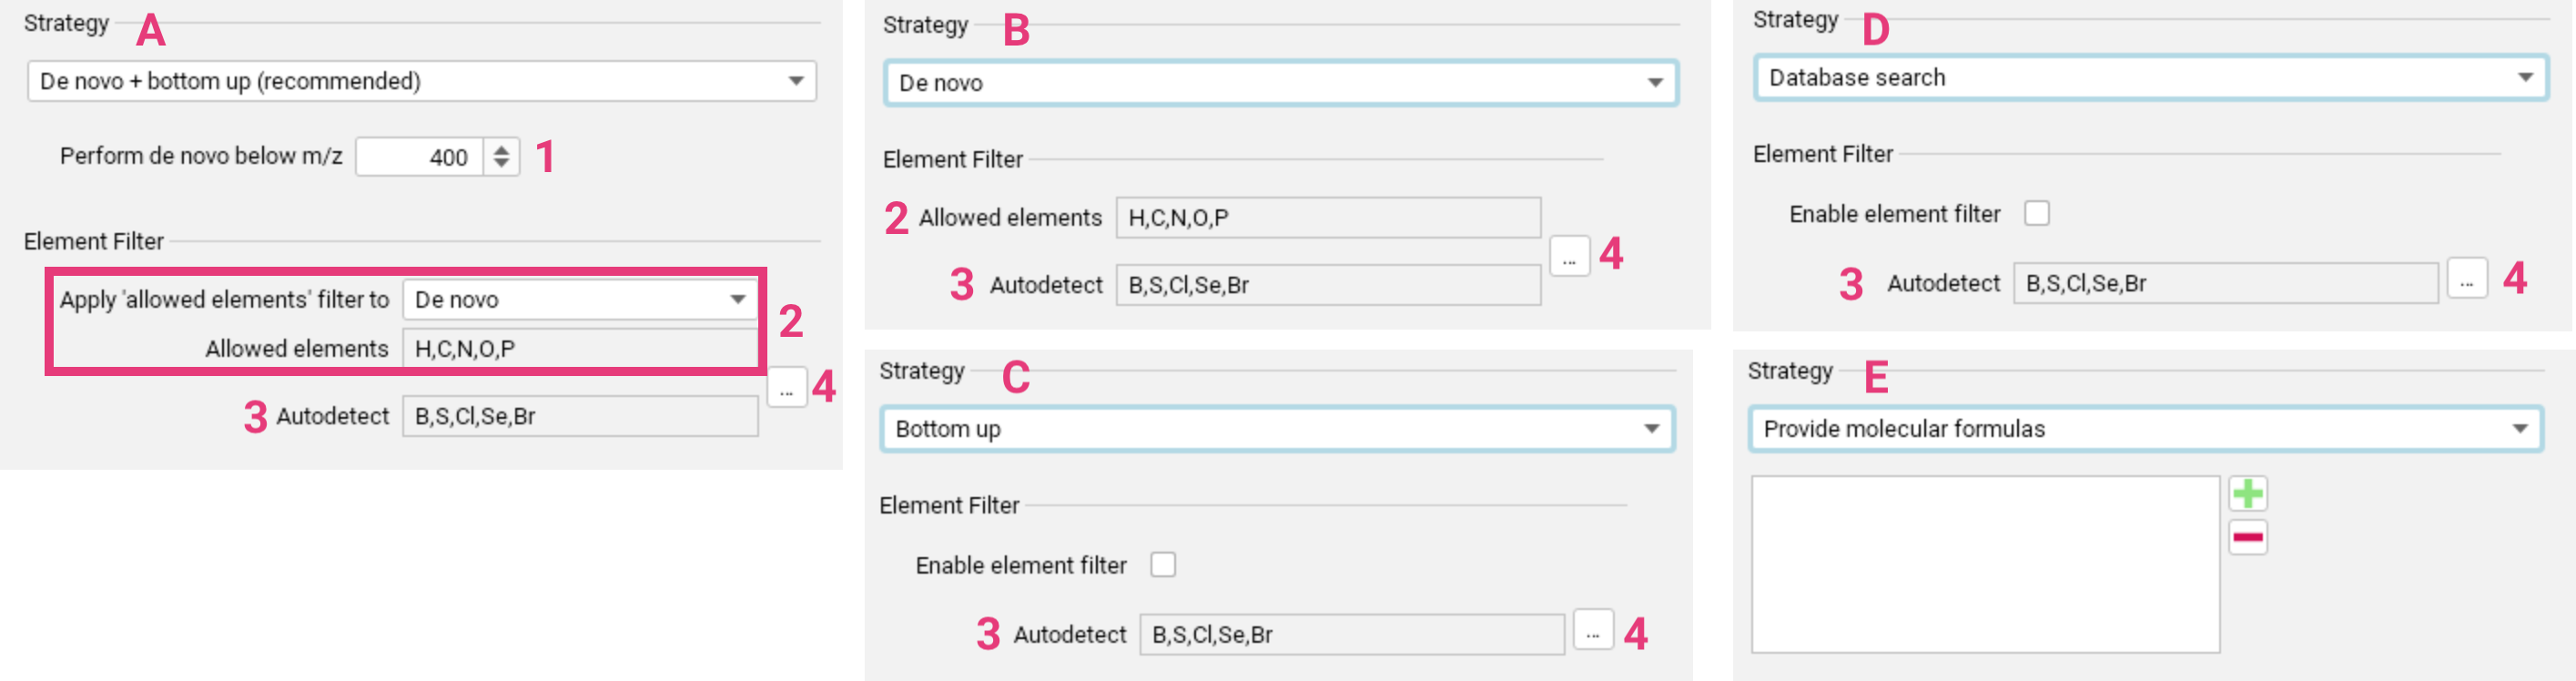
De novo + bottom up search [A] is recommended for generic applications. Learn more.
You can configure the m/z threshold [1] below which de novo molecular formula annotation will be performed alongside the bottom up search.
The element filter can be applied either solely to the de novo annotations or to the bottom-up search as well [2]. This filter only refers to the set of Allowed elements. You can set upper and lower limits for the elements in this set. The Autodetect set [3] specifies the elements
for which SIRIUS will automatically detect the presence, absence and quantity from the input data (requires MS1 spectra). This filter is applied to both, de novo and bottom-up search. Both sets can
be adjusted using the ... button [4]. Before making significant changes to the element sets, please consider the potential impact on running time and result quality.
De novo only [B] is recommended for discovering “unknown unknowns”. Learn more.
Here, the expected element set needs to be well-defined using the Element filter settings [2-4].
Allowed elements and Autodetect elements can again be adjusted using the ... button, with keeping in mind the impact on running time and result quality.
Bottom up search only [C] can be used for a slight speed increase compared to the recommended combined approach. Learn more.
Applying an element filter [5] is not mandatory for bottom-up search, but can be used to narrow down molecular formula candidates. Allowed elements and Autodetect elements can again be adjusted using the ... button [2-4].
Database search [D] is recommended for known compounds and extremely fast computation times. Learn more.
Applying an element filter [5] is not mandatory for formula database search, but can be used to narrow down molecular formula candidates. Allowed elements and Autodetect elements can again be adjusted using the ... button [2-4].
Specifying a molecular formula (or list of molecular formulas) [E] to run formula annotation.
If you have imported a peak list file containing a molecular formula, you cannot override this formula using the compute dialog. To avoid this, select Ignore Formulas during import.
Improve molecular formula ranking with ZODIAC
ZODIAC enhances de novo molecular formula annotation for complete biological datasets, that is high-resolution, high-mass-accuracy LC-MS/MS runs. It refines the ranking of molecular formula candidates by analyzing similarities among features in the dataset, using fragmentation trees as input.
To use ZODIAC, select both SIRIUS and ZODIAC in the compute panel. This is only possible for batch computation. To increase the chance of the correct molecular formula candidate to be in the result list, increase the number of reported candidates for SIRIUS.
!! Zodiac should not be used for non-biological samples (like standard mixtures) !!
For more details, visit the ZODIAC release page.
Advanced settings for ZODIAC
These parameters are very advanced and require a thorough understanding of ZODIAC and its underlying Gibbs sampler.
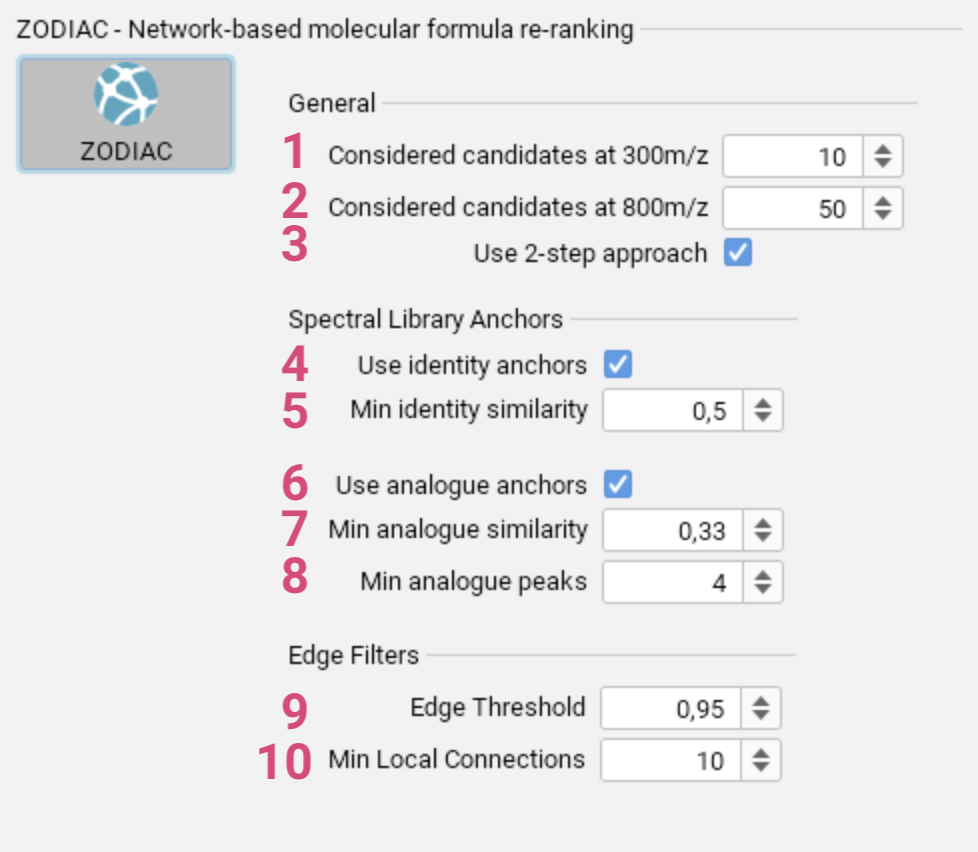
- Specify the maximum number of candidate molecular formulas considered
for features with m/z lower than 300. [1] - Specify the maximum number of candidate molecular formulas considered for features with m/z higher than 800. [2]
- Enable or disable the 2-step approach, where higher quality features are processed first, followed by lower quality features second. [3]
- Use identity matches [4] from spectral library search with given minimum similarity [5] as anchors in the network.
- Use analog matches [6] from spectral library search with given minimum similarity [7] and given minimum number of matching peaks [8] as anchors in the network.
- Set the threshold for the ratio of edges of the complete network to be ignored. [9]
- Specify the minimum number of connections required for each candidate. [10]
Predicting molecular fingerprints with CSI:FingerID and compound classes with CANOPUS
After computing the fragmentation trees, you can predict molecular fingerprints
and CANOPUS compound classes.
These predictions can then be used to search structure databases and/or to predict novel structures with MSNovelist.
If Score threshold is selected, fingerprints are only predicted for the top-scoring fragmentation trees (molecular formulas). This is recommended and should only be disabled if you need to examine
the fingerprint of a lower-scoring molecular formula. If ZODIAC scores were calculated, all molecular formulas with a probability ≥0.01 are used. Otherwise, the score threshold is the maximum of “85% of the top SIRIUS score” and “top SIRIUS score - 5”.
CANOPUS predicts ClassyFire compound classes from the molecular fingerprint, without using any structure database. Classes are predicted for all features whose fragmentation tree contains at least three fragments, including features with no matching structure candidates in the database. There are no parameters to set. Compound classes are predicted separately for each molecular formula.
For more details, visit the CANOPUS release page.
Identifying the molecular structure with CSI:FingerID
CSI:FingerID facilitates the identification of molecular structures by matching predicted molecular fingerprints against database structures. SIRIUS ships with a wide range of built-in databases. Additionally, users can enhance the search capabilities by adding their own structures as a “custom database” (see Import of custom structure and spectra databases which can then be searched alongside the existing databases. If you have imported your own spectral library that should be considered for structure database search, select these libraries (databases) in the global settings.
You can choose to use PubChem as a fallback database (if not selected as search space in the global settings) in case it contains a hit with higher confidence than
those found in the selected databases. For a detailed explanation, please refer to the
Methods section.
The Confidence mode controls whether the approximate (A) or exact (E) confidence mode is used to assess if a
hit in PubChem is more reliable than the hits in the selected databases.
COSMIC confidence scores are calculated automatically and without requiring any parameters every time a CSI:FingerID search is performed.
COSMIC scores are displayed in the feature list on the left. Starting with SIRIUS 6, confidence scores
are computed in both exact and approximate mode.
For more details,
see the COSMIC section or
visit the COSMIC release page.
Generating de novo structure candidates with MSNovelist
In some cases, it is necessary to go beyond the limits of structure database search. To address this, SIRIUS 6 newly offers de novo generation of candidate structures through MSNovelist, in addition to predicting molecular fingerprints and compound classes, as well as searching in custom databases.
Be aware that the likelihood of any de novo generation method performing well for truly novel compounds is very low. Therefore, the results from MSNovelist should rather be considered as suggestion or starting point for semi-manual analysis of compounds that cannot be elucidated otherwise.
MSNovelist will significantly slow down your SIRIUS workflow; use with caution.
Visualization of the results
The feature provides not only information about the input and compute state, it also displays the COSMIC confidence score for the top CSI:FingerID hit.
For each feature, different result views can be displayed by switching between the tabs in the result panel:
- The LC-MS view displays the chromatographic feature alignment as well as a quality assessment of the spectra. This tab is only in use for mzML and mzXML inputs.
- The Formulas view displays the results from the molecular formula identification.
- The Predicted Fingerprints view contains information about the molecular properties of the molecular fingerprint predicted by CSI:FingerID.
- The Compound Classes view shows the Classyfire classes predicted by CANOPUS.
- The Structures view displays results from the CSI:FingerID structure search.
- The De Novo Structures view displays MSNovelist-generated structure candidates for the current query.
- The Substructure Annotations view shows possible substructures connected to the peaks of the MS/MS spectrumfor each candidate.
- The Library Matches view shows matches to reference spectra if a spectral library was imported.
- The Homologous Series view visualizes groups of related molecules, that share the same basic structure but differ by a consistent building block.
In all views, the top CSI:FingerID hit (as well as “highly similar” compounds in approximate confidence mode) is highlighted in green.
LC-MS view
The LC-MS tab is hidden when no LC-MS data (.mzML or .mzXML) was imported, i.e. if the data is imported as .mgf, .ms or similar file formats, no LC-MS information is available. This is also the case when LC-MS data has been processed with OpenMS or mzmine and then imported to SIRIUS.
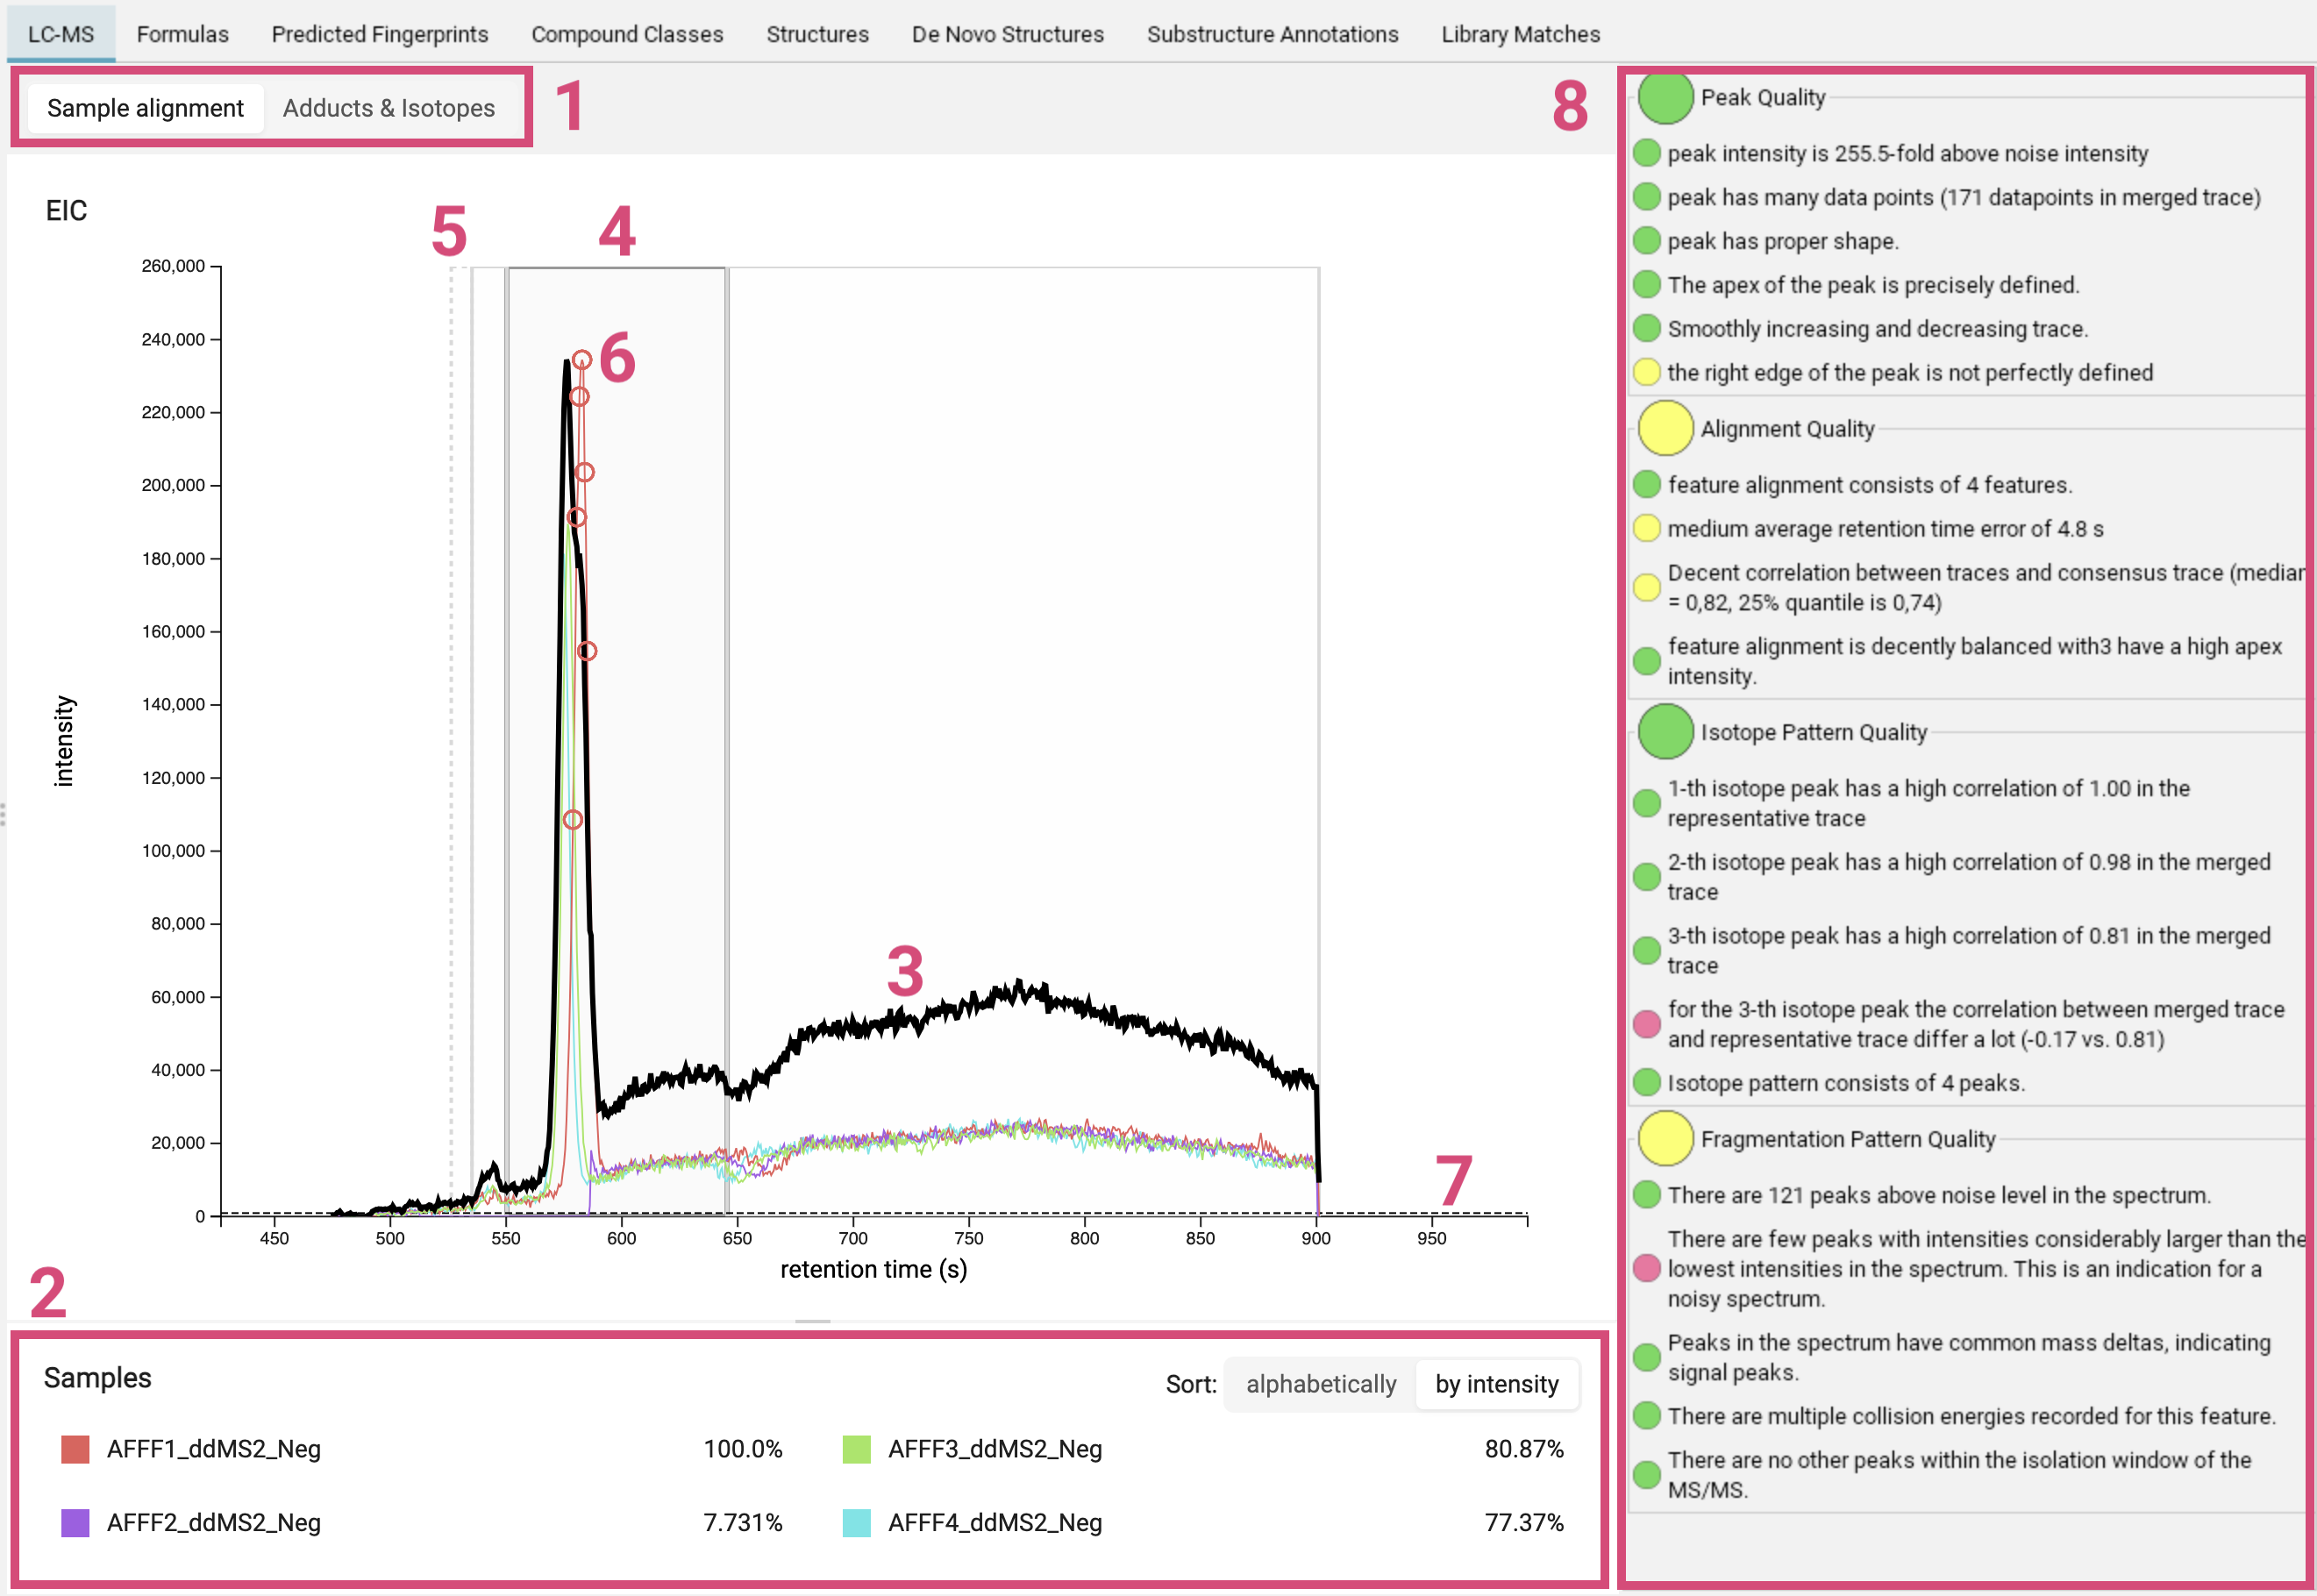
The LC-MS view displays the ion chromatogram of a feature. You can choose whether to show the sample alignment or the adduct/isotope assignment [1]. Retention times are given in seconds.
For the feature alignment, the mass traces of all runs aligned for this feature are displayed in different colors [2]. The thick black line is the merged mass trace [3]. The bold grey box highlights the selected feature [4]. Other nearby features are marked with thin grey boxes and features with low quality are marked with dashed boxes [5]. The circles [6] indicate where the MS2 spectrum was measured. You can click on a box to zoom into the feature. A gray dashed line [7] marks the noise level; its exact computation may vary from version to version, but it is related to the median intensity of all peaks in the MS scan.
On the right, there is a basic quality assessment panel [8]. It can be used to preemptively get an idea on overall quality of the MS and MS/MS of the feature.
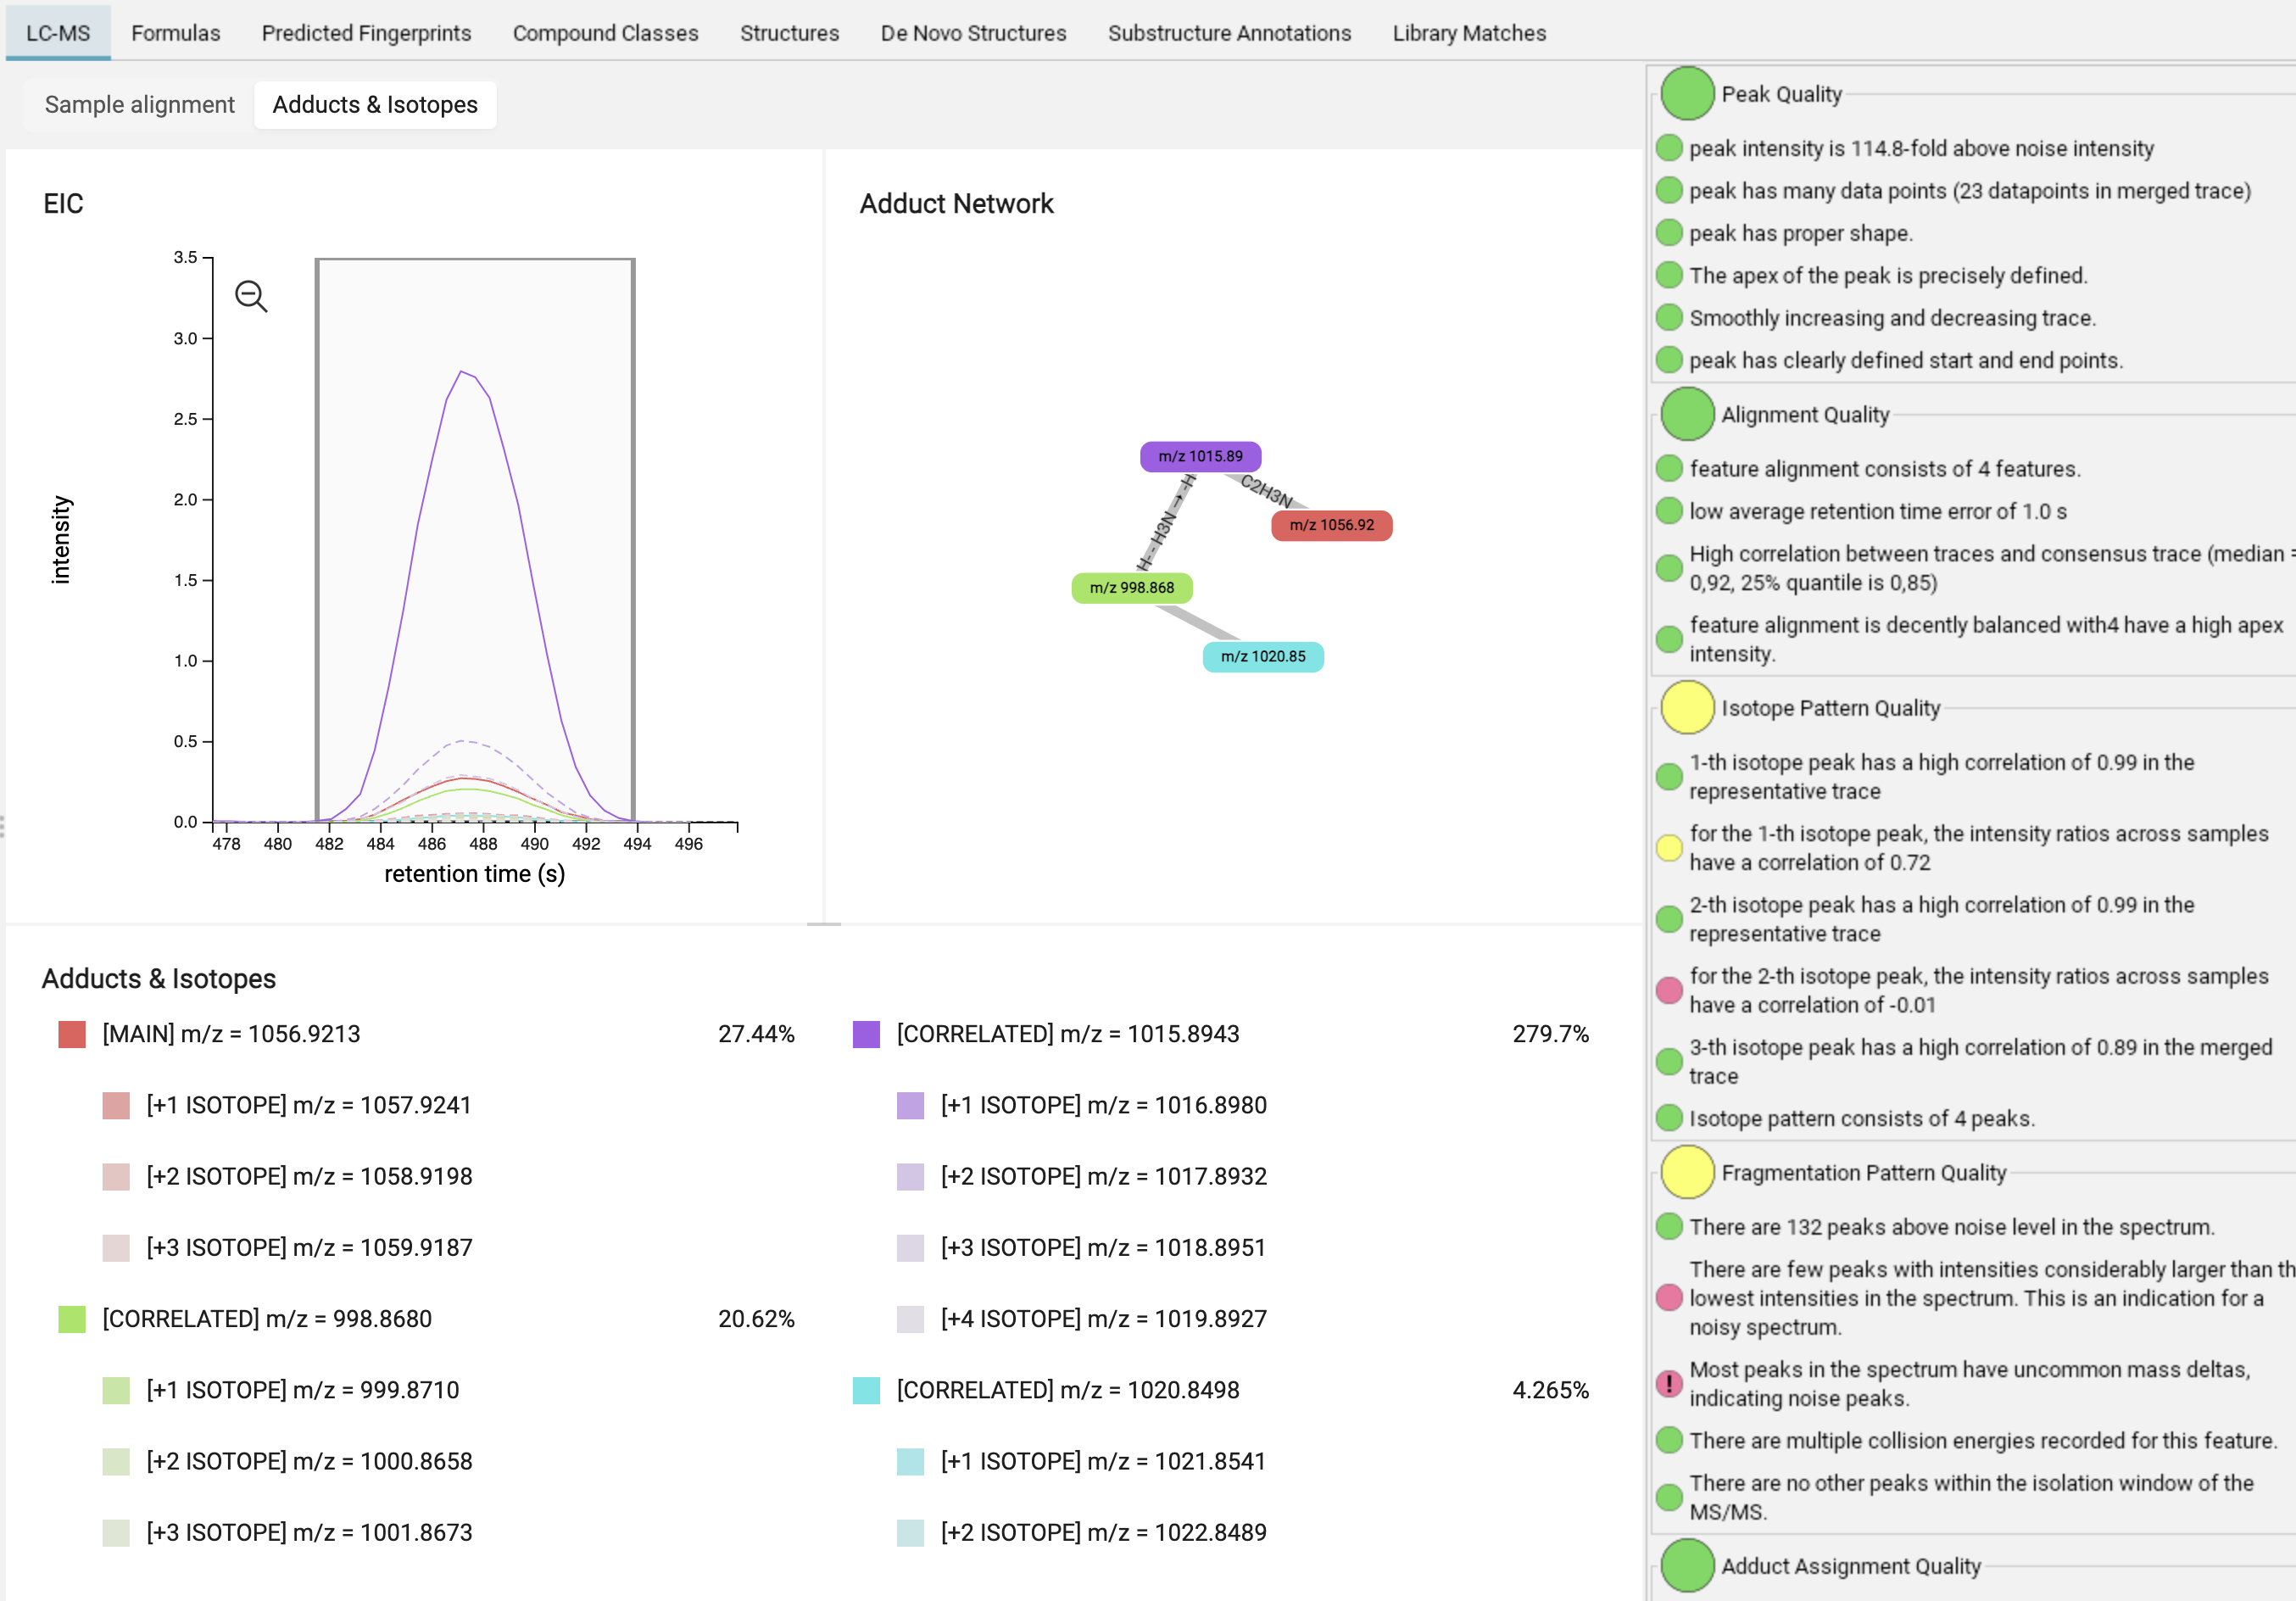
In the adduct/isotope assignment view, you can find the merged mass trace of the feature (MAIN, red) as well as its isotopes (lighter red / dashed lines) and correlated adducts (CORRELATED, additional colors) with their isotopes (dashed lines). Hovering over the edges and nodes of the adduct network provides information about adduct probabilities and correlations. Right-click on the nodes offers direct navigation (jump) to related features.
Formulas view
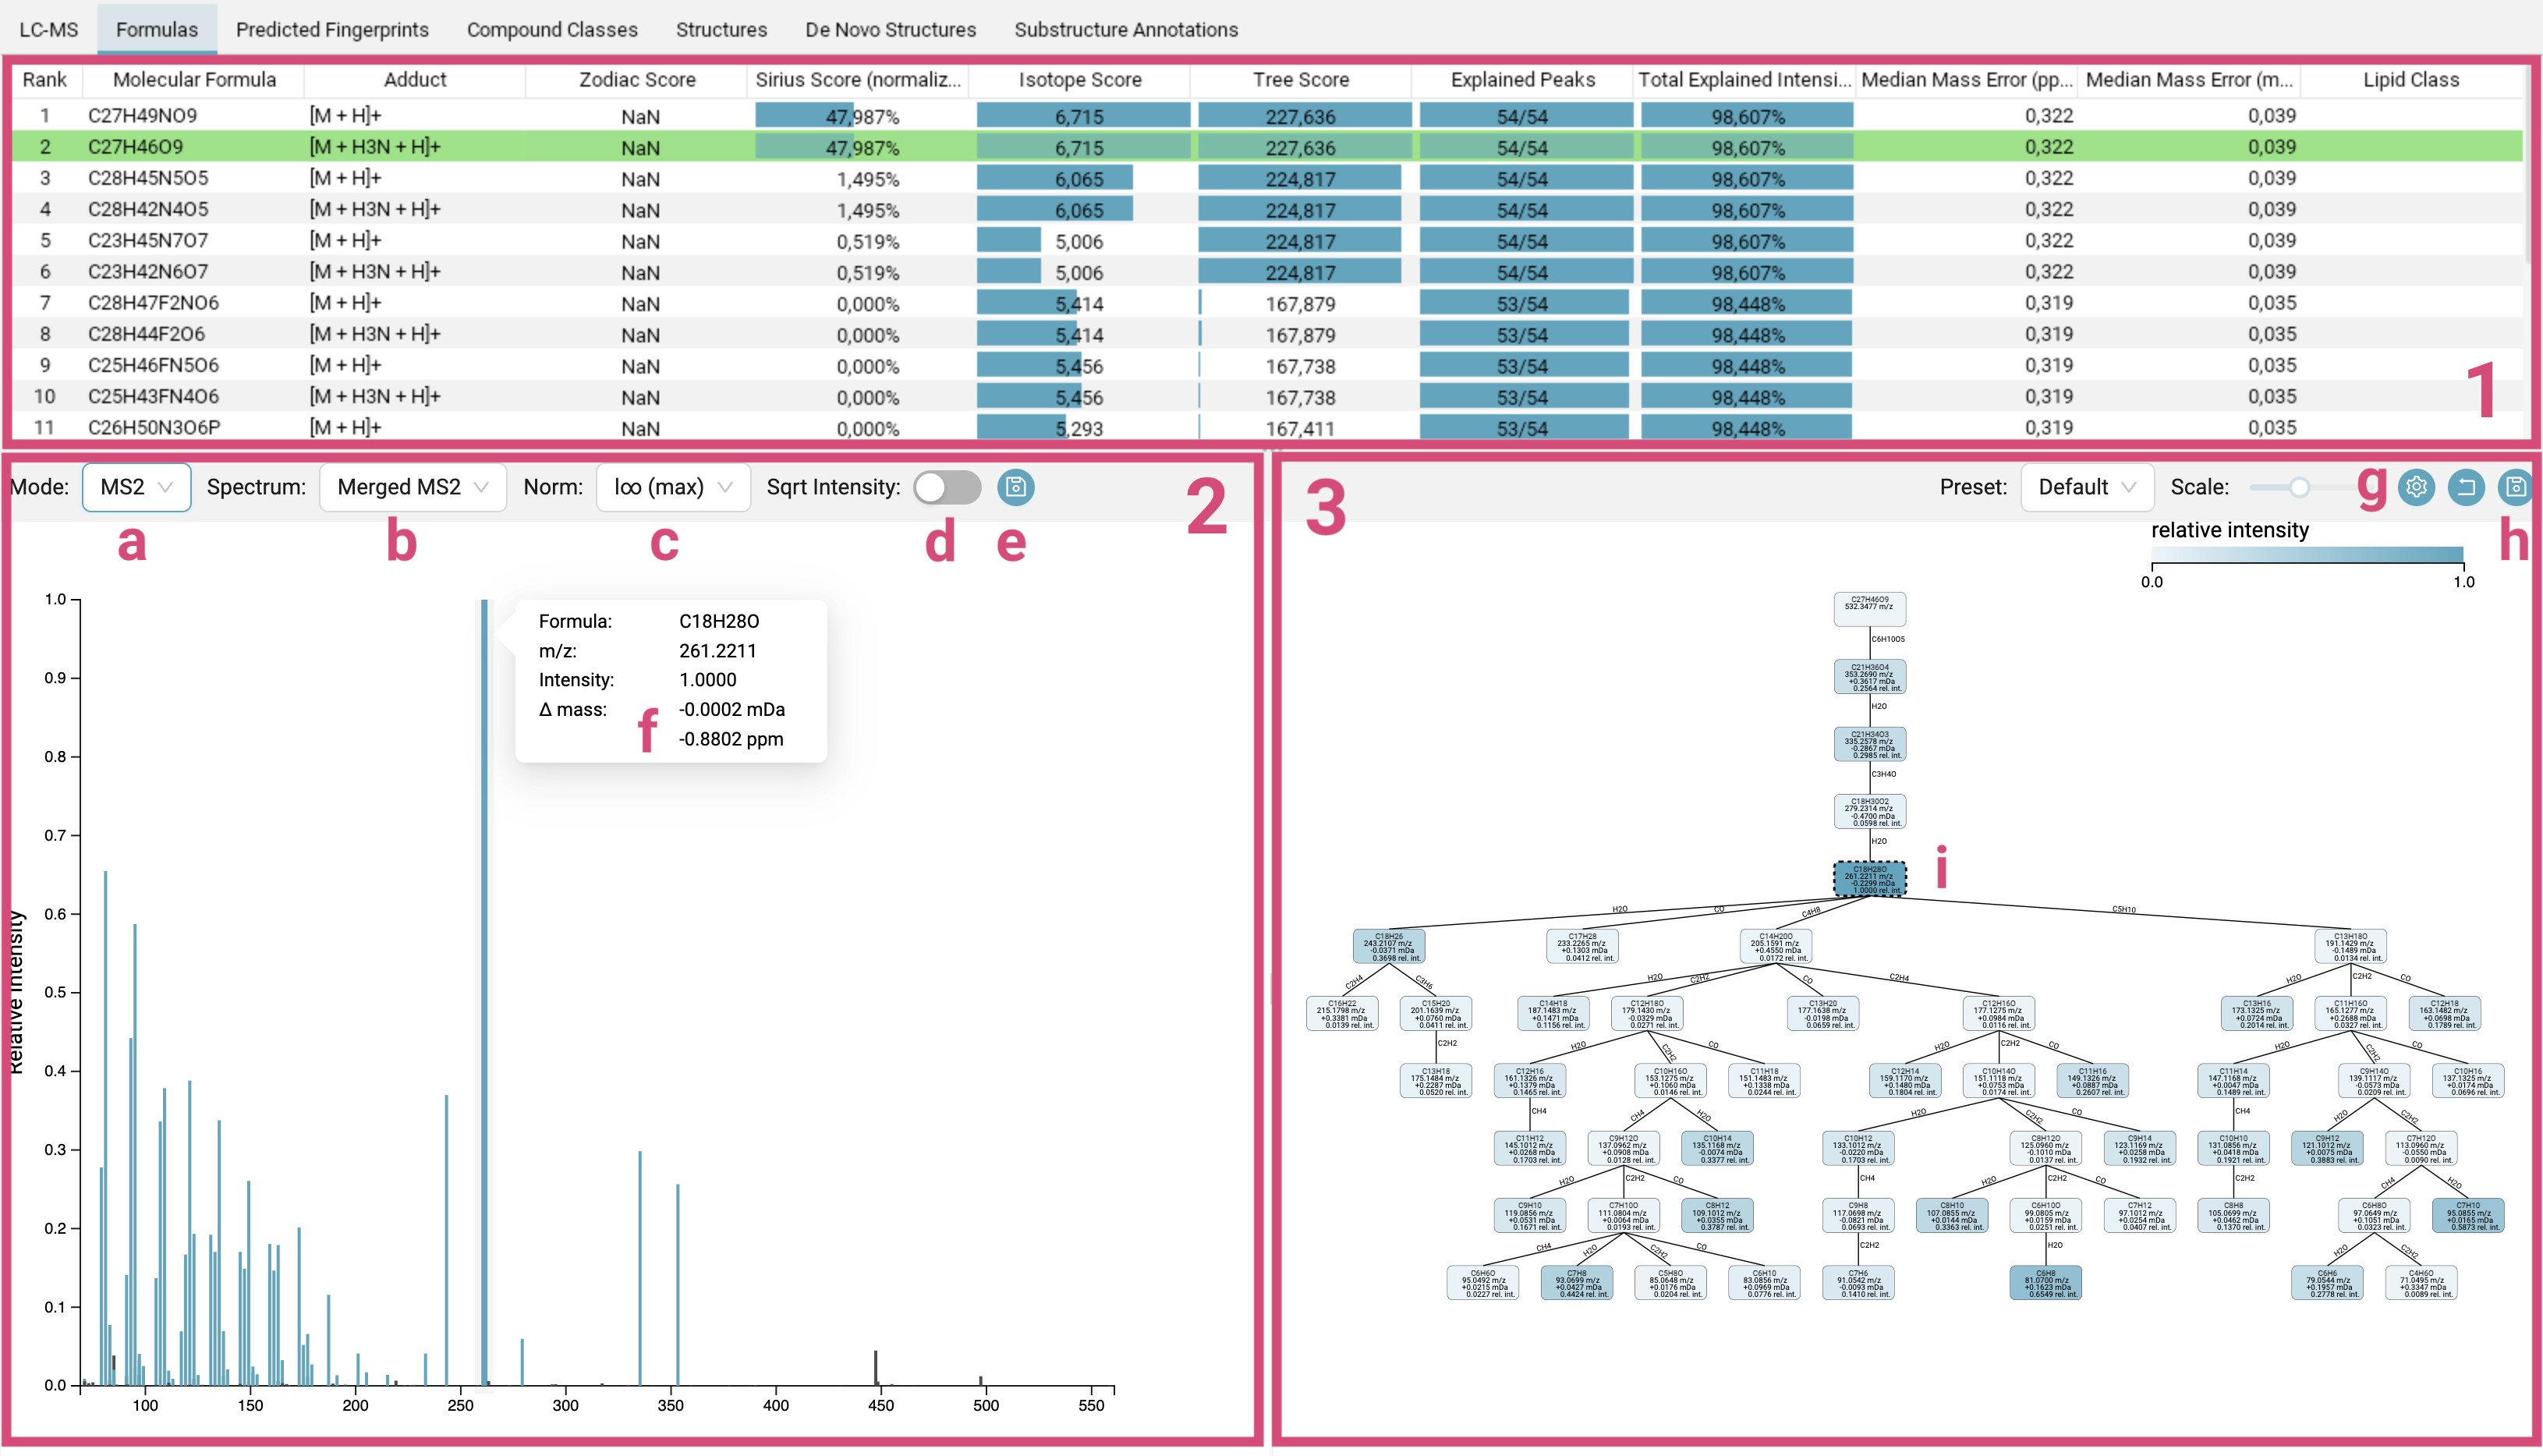
The Formulas tab displays the molecular formula candidate list [1], the mass spectra [2] and the fragmentation tree [3] of the selected feature.
-
Molecular formula candidate list [1]: The candidates are ranked by the SIRIUS score. The molecular formula of the best candidate structure found by CSI:FingerID is highlighted in green (and does not necessarily have to be the candidate with the best SIRIUS score). Per default, the candidates are ordered by SIRIUS score but can be sorted by any other column.
The
Sirius Scoreis a combination of the score from the isotope pattern analysis (Isotope Score) of the MS1 data and the fragmentation tree score (Tree Score) from the MS2 data. It is calculated by summing both scores and then converting them into probabilities using the softmax function. These probabilities sum to one. While a higher posterior probability for the top hit might suggest that this molecular formula is more likely to be correct, it is important to note that a posterior probability of 90% does not mean there is a 90% chance that the molecular formula identification is correct! The displayed probabilities are neither q-values nor Posterior Error Probabilities. The bars visually represent this value, with a full bar indicating the highest score in the column. The SIRIUS score is the primary score that users should focus on.The
Isotope ScoreandTree Scorethemselves are log-transformed posterior probabilities. The bars range from the lowest score in the column (empty) to the highest score in the column (full).The
Zodiac Scoreis also a probability, and here too, the bars directly represent this value. -
Mass spectra [2]: In this panel you can switch between the MS1 spectrum, the MS1 isotope pattern mirror plot or the MS2 spectra [a]. For MS2 spectra, per default a merged spectrum is displayed, but you can also choose to view individual spectra [b]. You can change the scaling of the intensities to different normalisations [c], with either the highest intensity peak in the spectrum normalized to 1, and all other peaks represented as fraction of this maximum (
l∞ (max)), or the sum of the intensities normalized to 1 (l1 (sum)), or the sum of the squares of the intensities normalized to 1 (l2, Euclidean normalization). You can also apply a square root transformation to the intensity values (Sqrt Intensity) [d], which is particularly useful for spectra containing a few extremely high-intensity peaks alongside many low-intensity peaks that are nevertheless important for analysis. In the MS2 view, peaks annotated by the fragmentation tree are highlighted in blue, while those identified as noise are colored black. Hovering over a peak will display its detailed annotation [f], and clicking on a blue peak will highlight the corresponding node in the fragmentation tree [i]. Spectra views can be exported using the top right export button [e]. -
Fragmentation tree [3]: In the computed fragmentation tree, each node assigns a molecular formula to a peak in the (merged) MS2 spectrum. Each edge is a hypothetical fragmentation reaction. You can customize the tree’s appearance by selecting different node styles and color schemes [g]. The tree can be exported [h] as SVG vector graphics or PNG.
Predicted Fingerprints view
Even if CSI:FingerID does not identify the correct structure — in
particular if the correct structure is not present in any structure database —
you can still get valuable information about the structure by examining the predicted fingerprint.
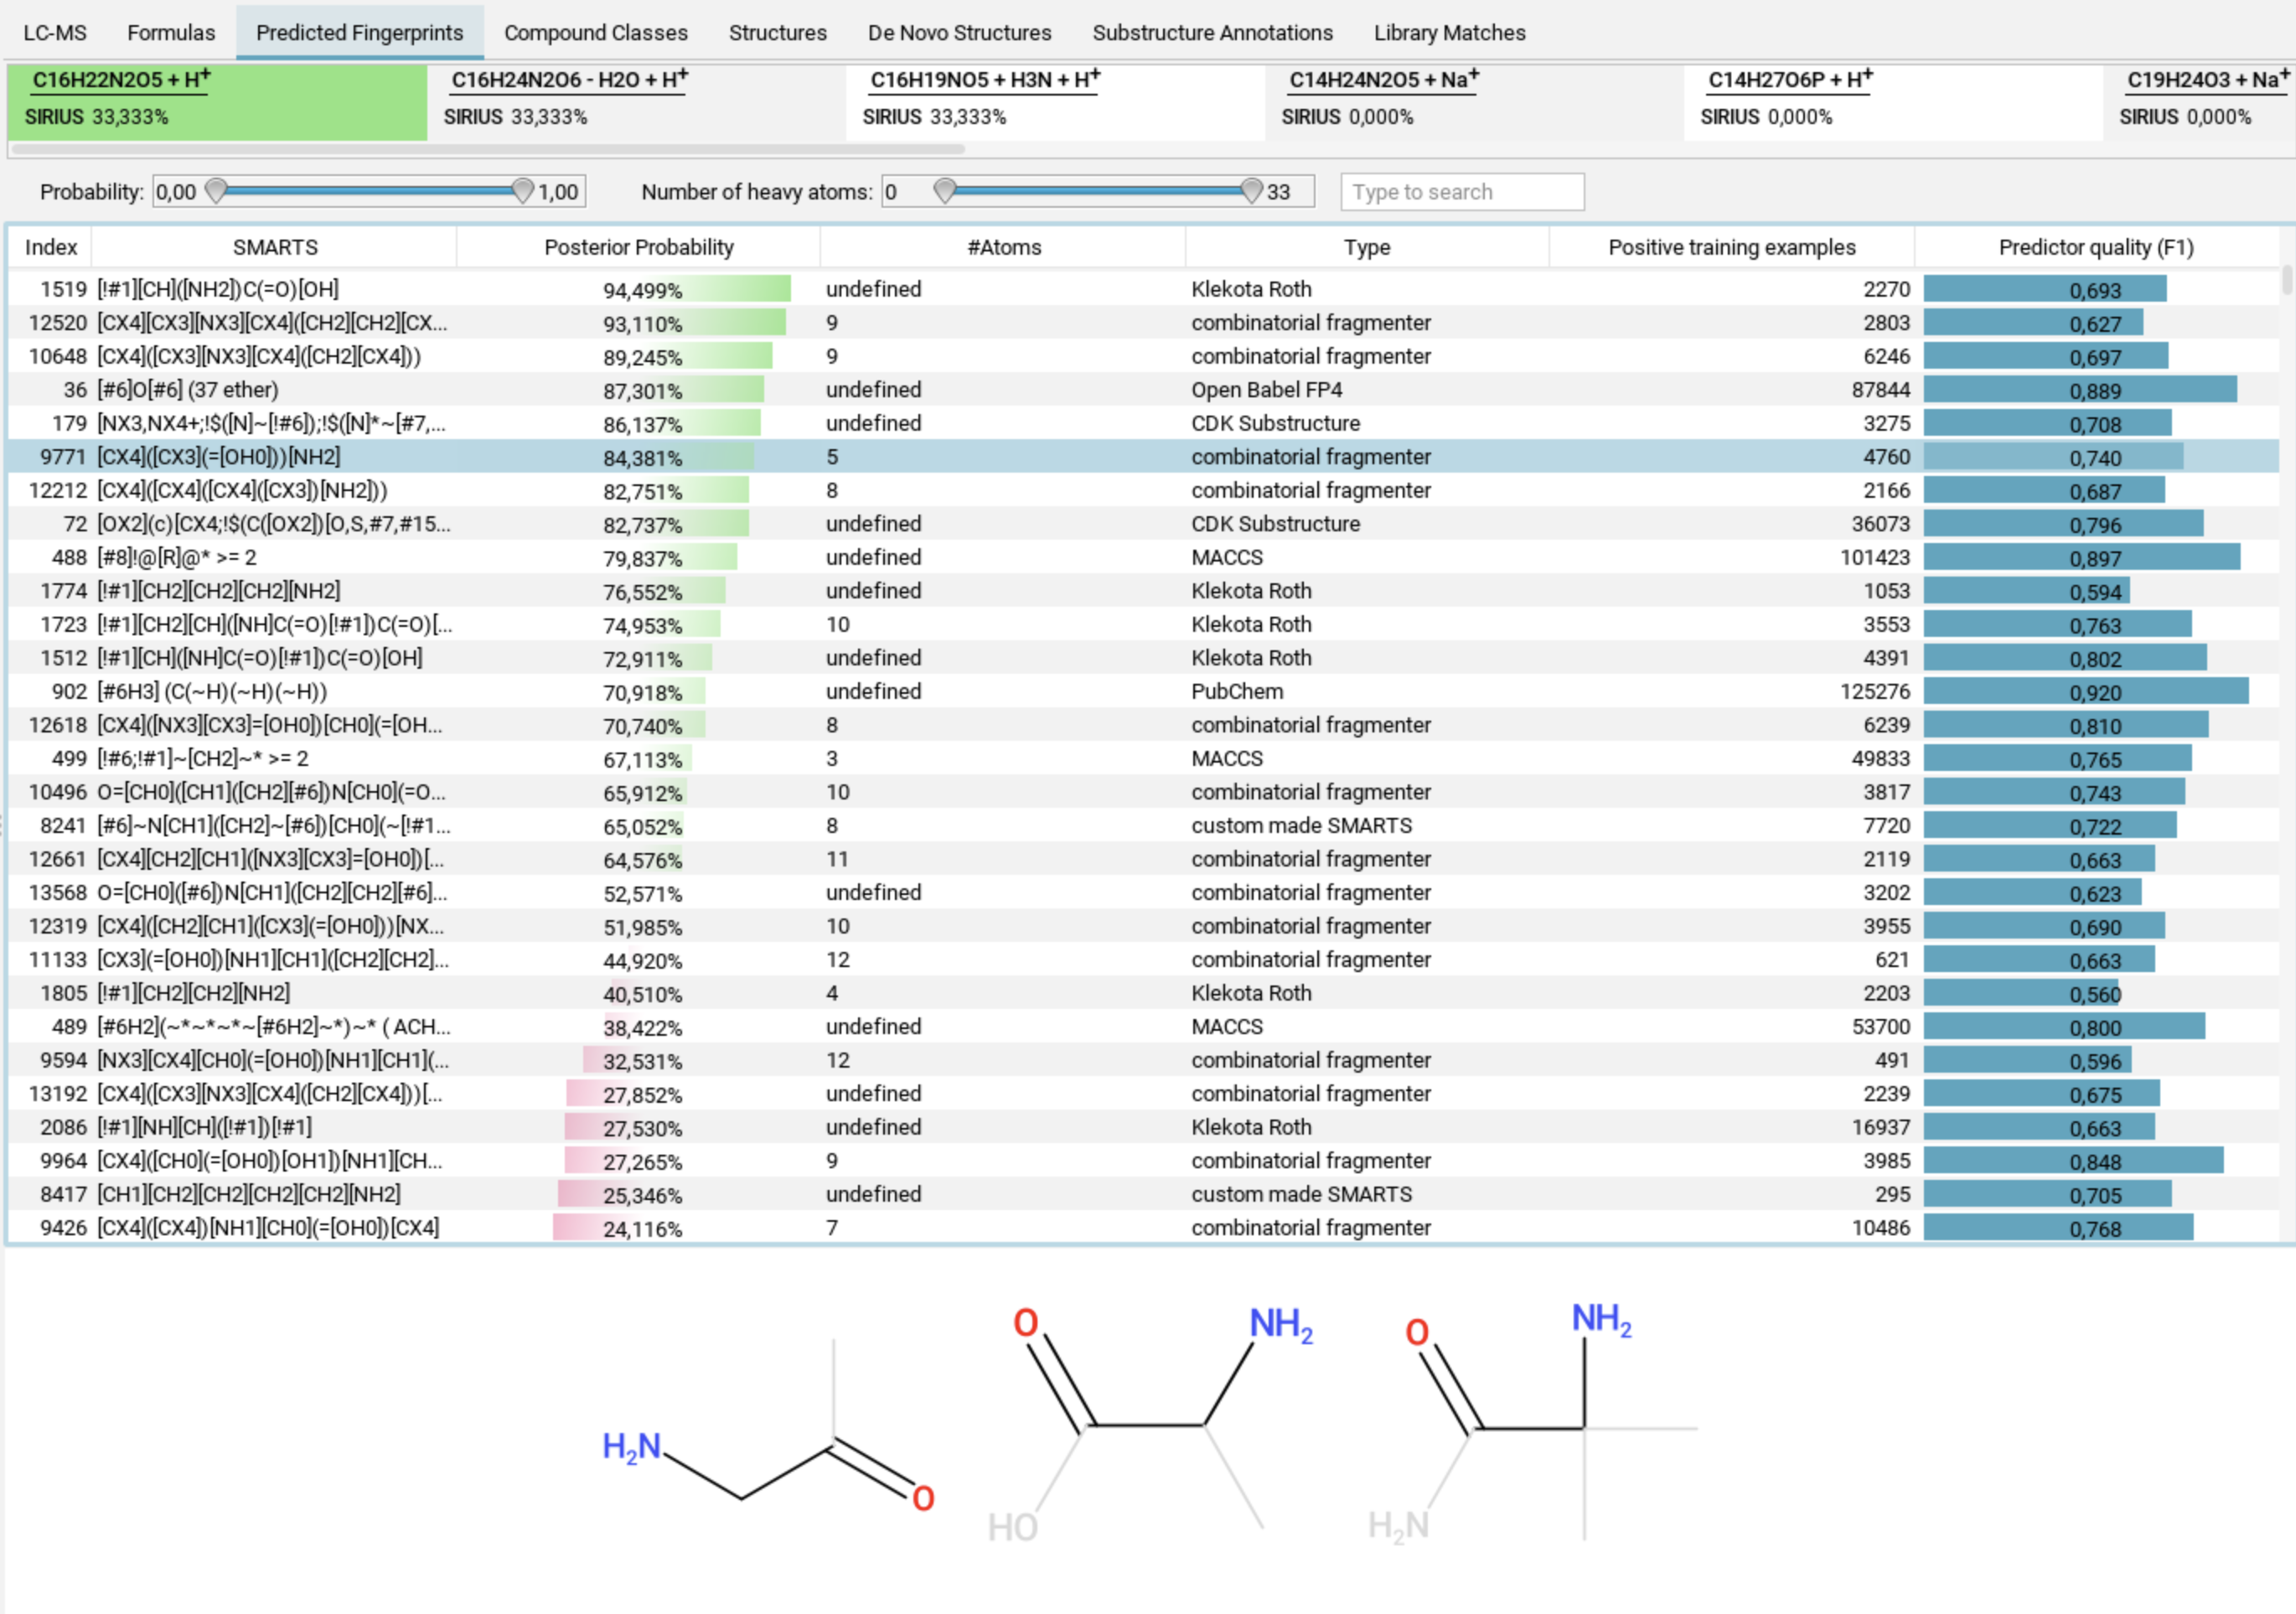
The Predicted Fingerprints tab displays a list of all molecular properties that make up the predicted fingerprint. When you select a molecular property, examples related to that property are shown below the list.
Compound Classes view
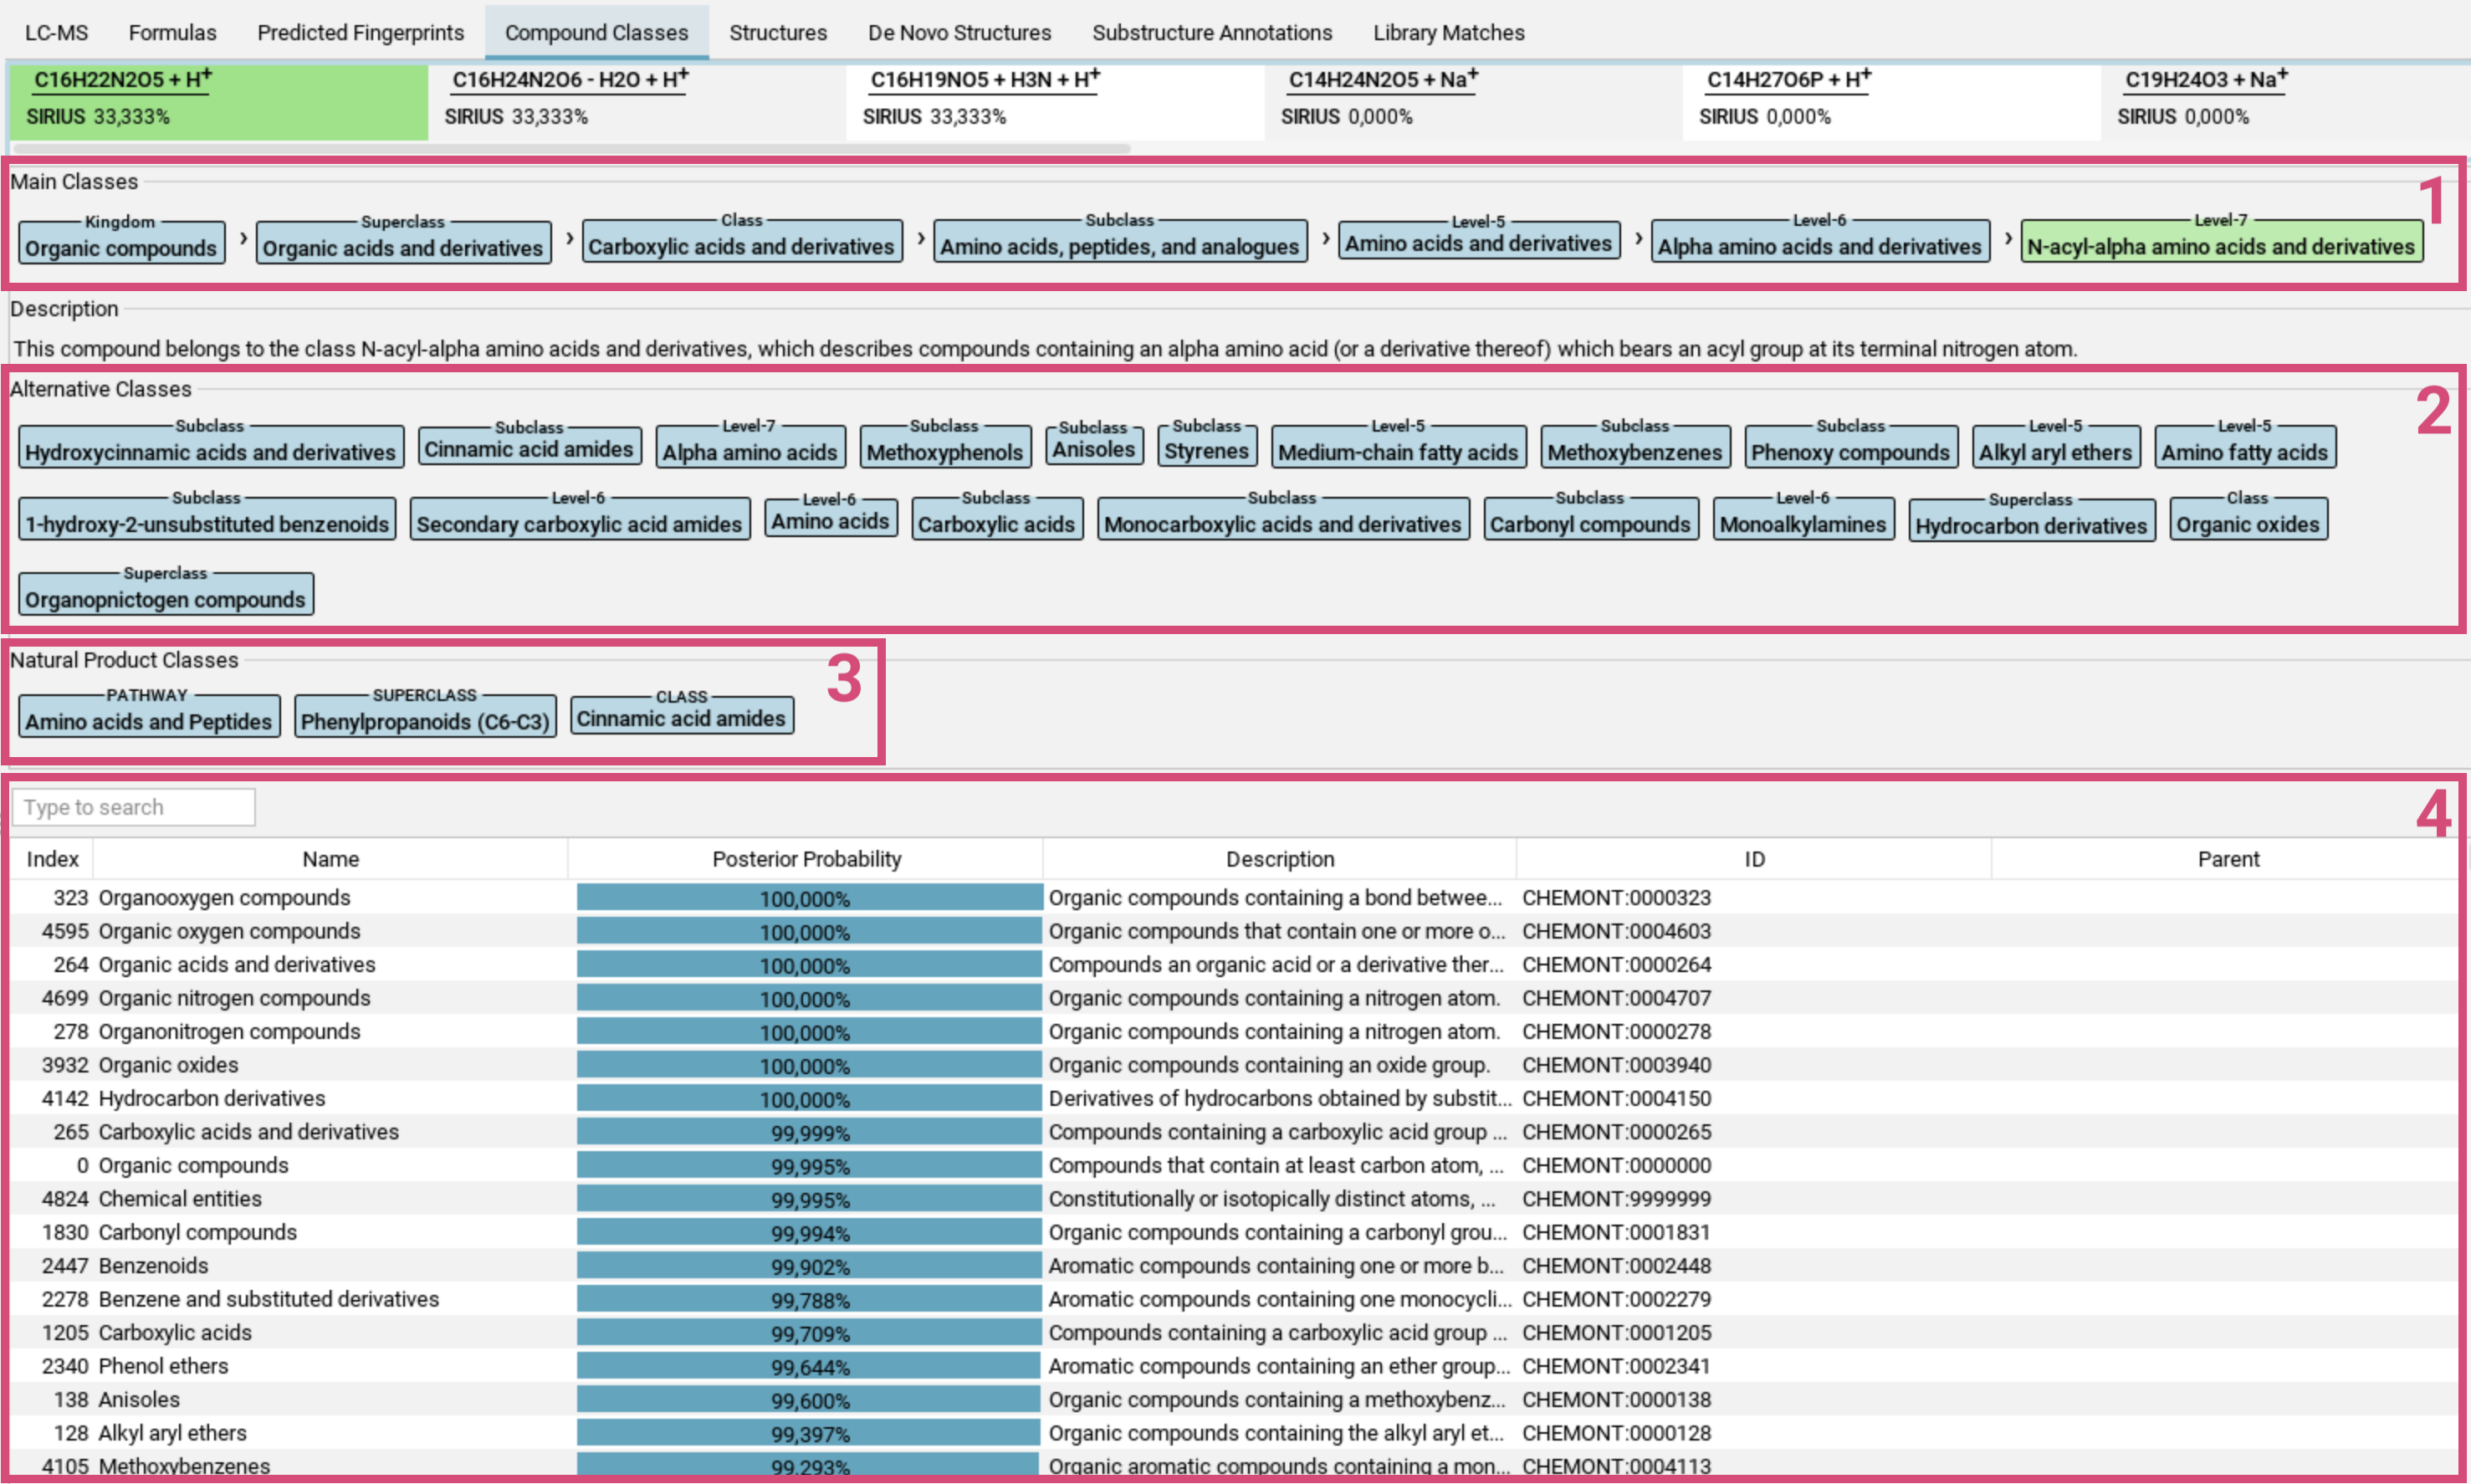
The Compound Classes tab visualizes the CANOPUS compound class predictions in a table format [4]. Each row in the table represents
one compound class. The Posterior Probability (number and bar) indicates the likelihood that
the measured spectrum, given the chosen molecular formula,
belongs to that class. Additional columns provide related information from the
ClassyFire ontology, e.g. the respective parent class.
Above the table are two lists: Main classes and Alternative Classes.
- Main Classes [1]: The main class of a feature is the most specific compound class with the highest priority from all compound classes with posterior probability above 50% (in green), along with its ancestor classes (in blue) in the ClassyFire ontology.
- Alternative classes [2]: This list contains all other classes with posterior probability above 50%. In the ClassyFire chemontology, each compound is assigned to multiple classes.
- Natural Product Classes [3]: Starting from version 5, SIRIUS also predicts Natural Product classes.
Structures view
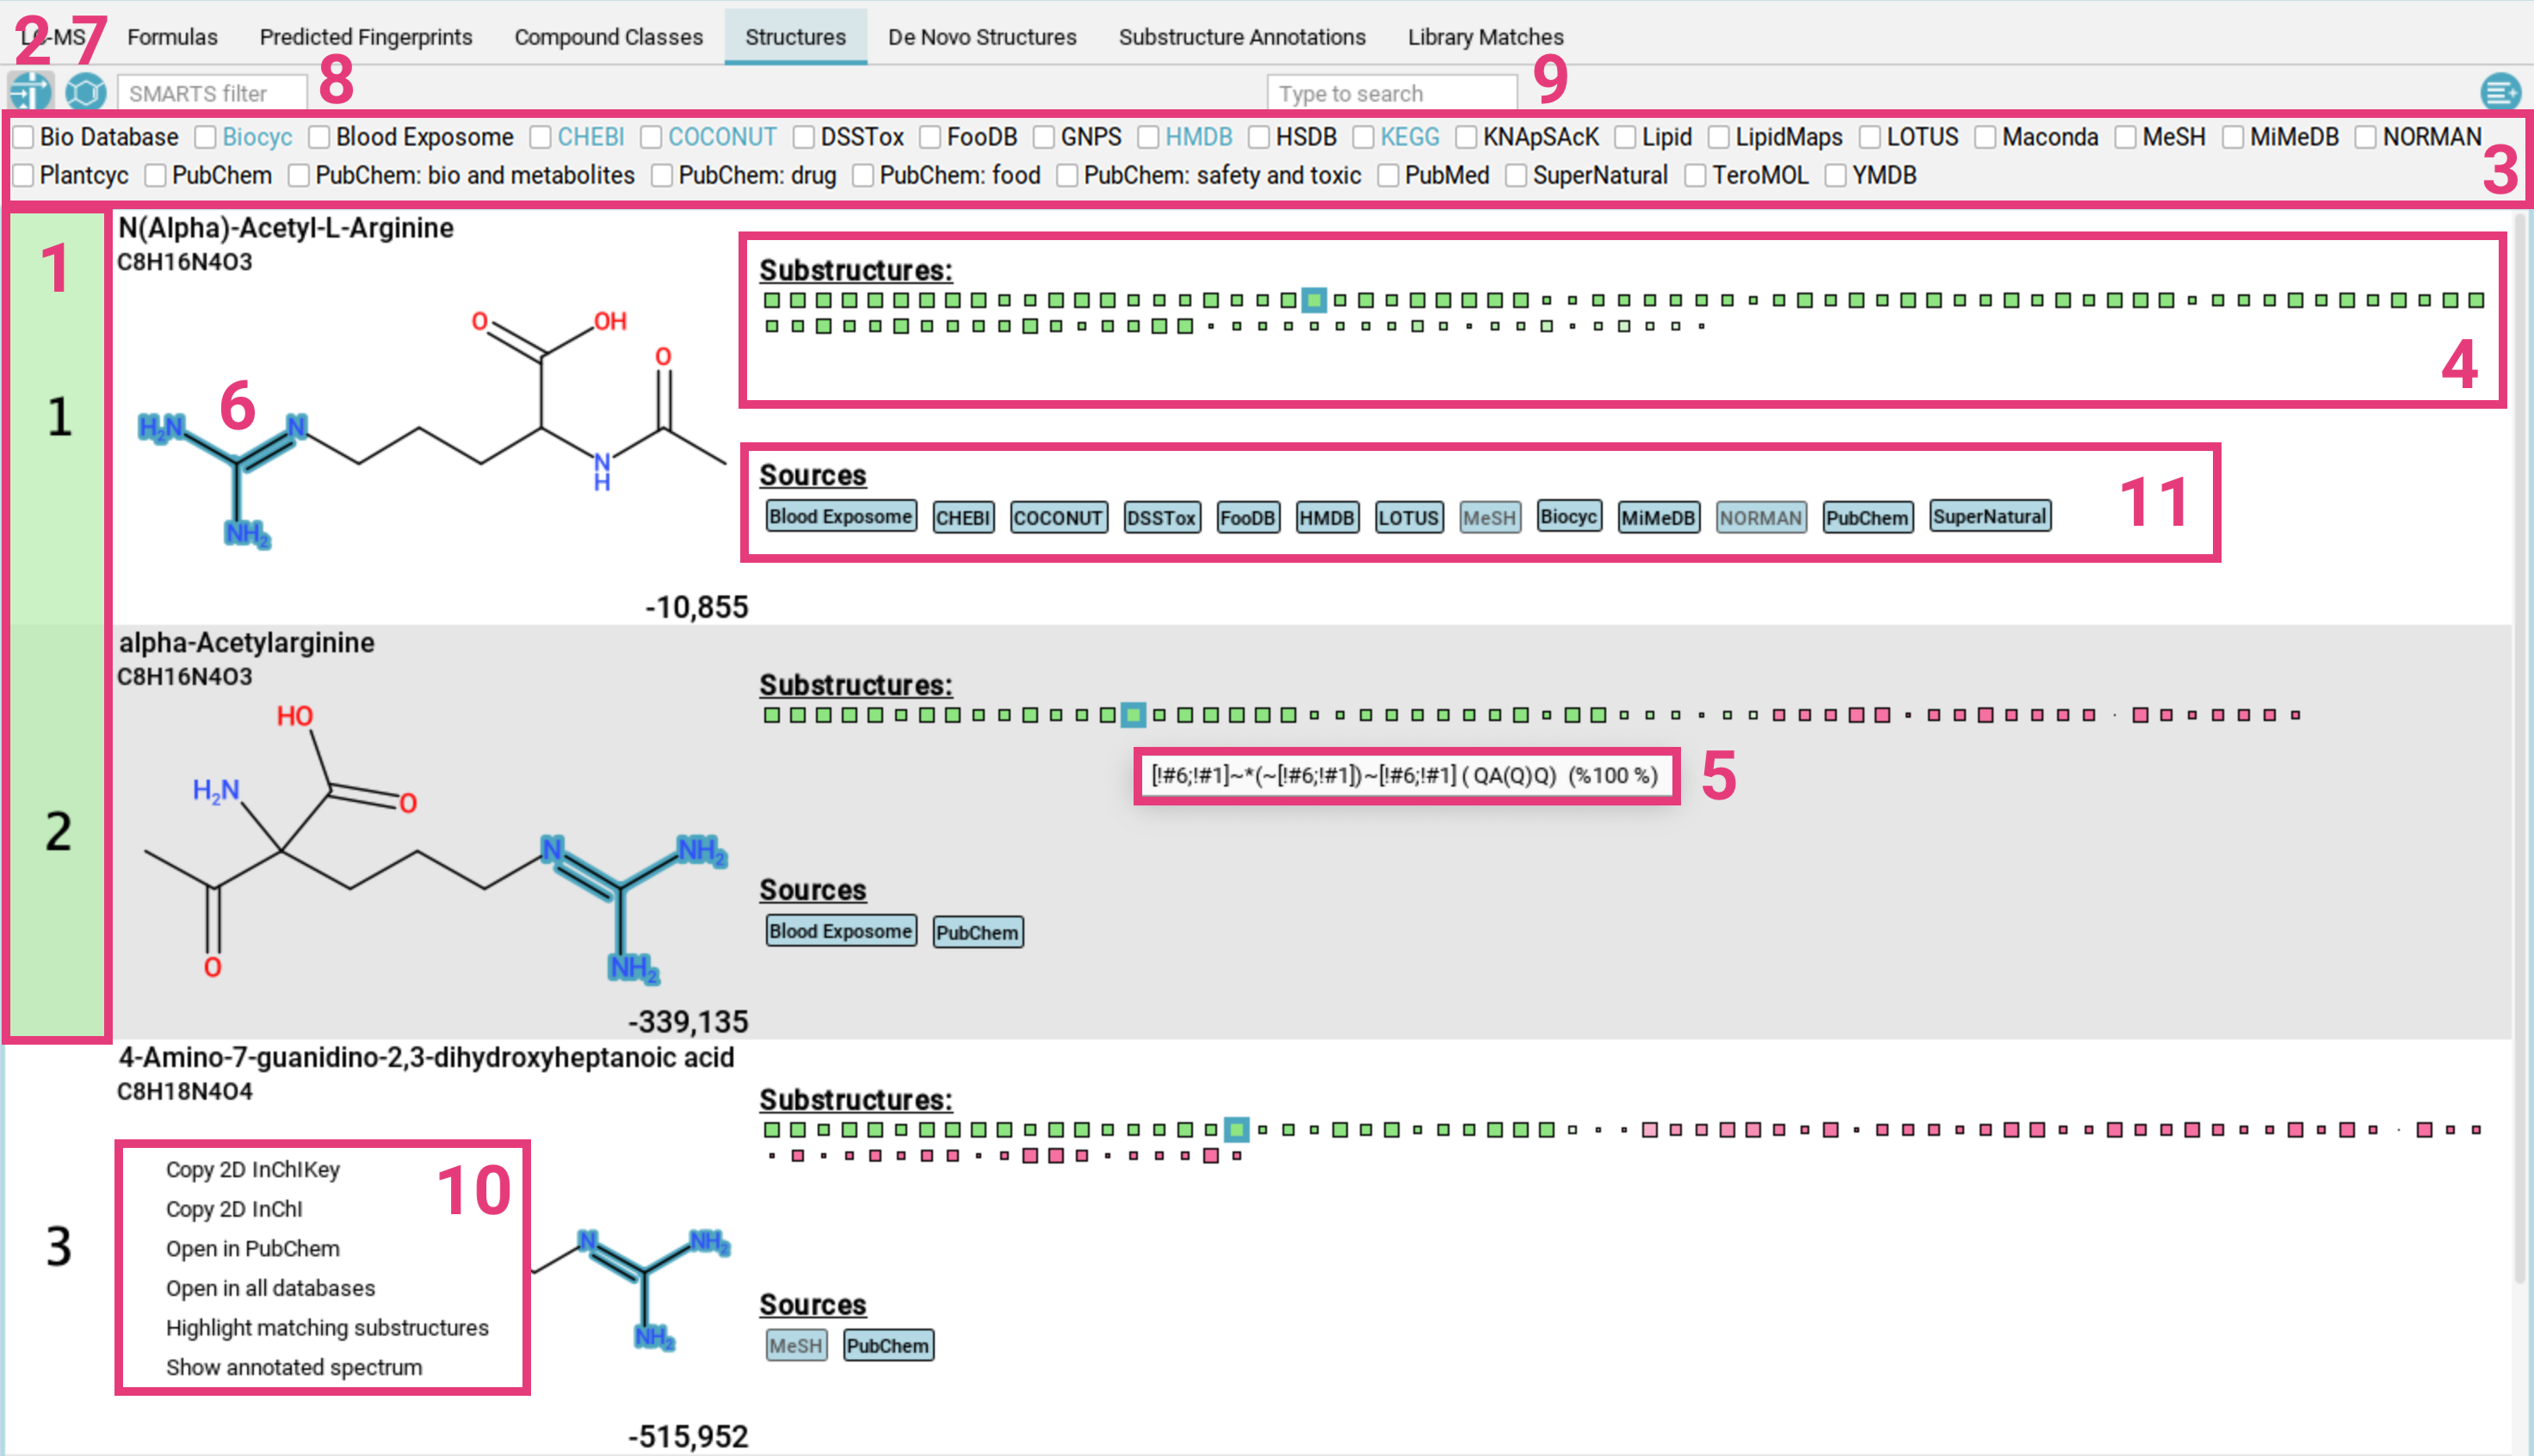
The Structures tab displays candidate structures for the selected
molecular formula, ranked by the CSI:FingerID search score.
The highest-scoring candidate is highlighted
in green [1]. If you have enabled approximate confidence mode, all candidates within an MCES distance of 2
will also be highlighted (see Expansive search).
Filter results: To filter the candidate list by a specific database (e.g., only compounds from KEGG and BioCyc), click the filter button [2] in the top left corner. A menu [3] will open, displaying all available databases. Only candidates from the selected databases will be shown. The databases that have been used for the structure database search are highlighted in blue. If PubChem has been used as fallback, it will be highlighted in pink.
The green and pink squares are a visualization of the CSI:FingerID predictions and scoring [4].
- Green squares represent molecular substructures present in the candidate structure that are predicted by CSI:FingerID to be present in the measured feature. The intensity of the color indicates the predicted probability, and the size of the square reflects the reliability of the predictor.
- Pink squares represent substructures that are predicted to be absent but are, nevertheless, found in the candidate structure. The intensity of the color reflects the probability that the structure should be absent.
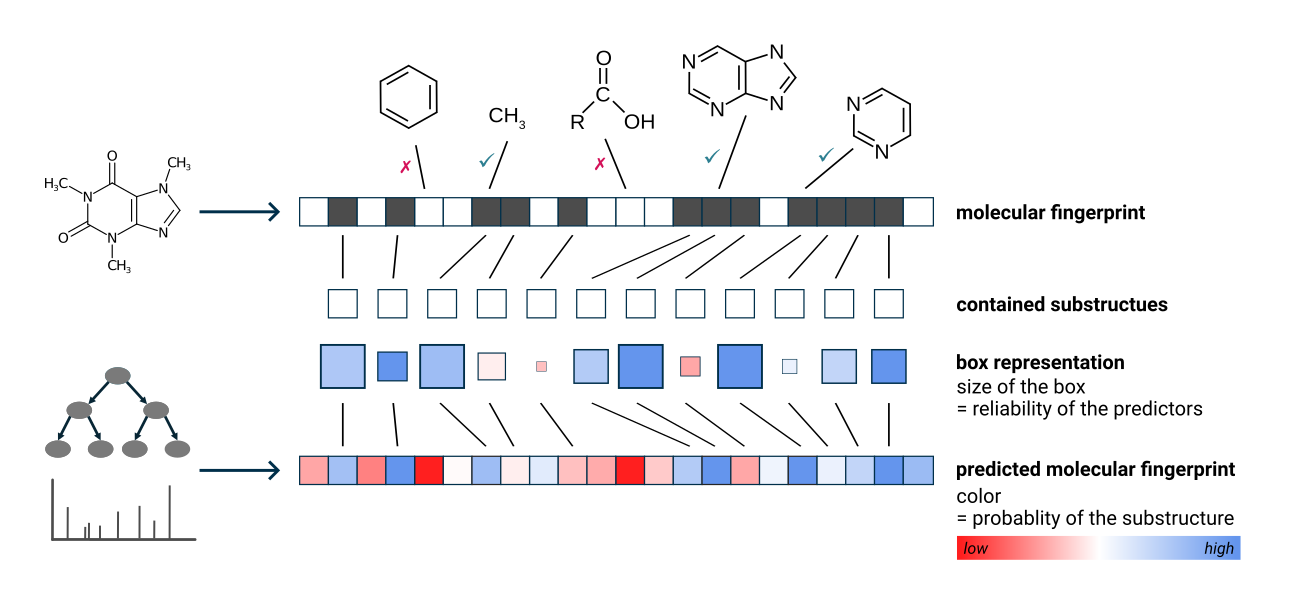
Overall, a correct prediction is typically characterized by many large, intense green squares and as few large, intense pink squares as possible.
Hovering over a square displays the description of the molecular substructure (usually a SMARTS expression) [5]. Clicking on a square highlights the corresponding atoms in the molecule [6]. If the substructure appears multiple times, the first appearance is highlighted in dark blue, while the other matches are highlighted in translucent blue. Hovering over the structure displays a zoomed-in preview, providing a more detailed view.
To filter the candidate list for for structures that contain the selected substructure, use the other filter button in the top left corner [7]. You can also filter by SMARTS pattern [8] or using the full-text search [9].
Right-clicking on a proposed structure opens a context menu [10], allowing you to:
- Copy the InChI or InChI Key to your clipboard
- Open the compound in PubChem
- Open the compound in all databases
- Highlight matching substructures
- Show the annotated spectrum in the
Substructure Annotationstab
Highlight matching substructures:
When you choose Highlight matching substructures from the context menu, substructures in all structure candidates will be color-coded as follows:
- green: substructures that are supported by fingerprint evidence.
- pink: substructures that contradict fingerprint evidence.
- yellow: substructures with mixed support, where both agreeing and disagreeing fingerprint evidence is present.
- no color: substructures that are not clearly covered by fingerprint evidence
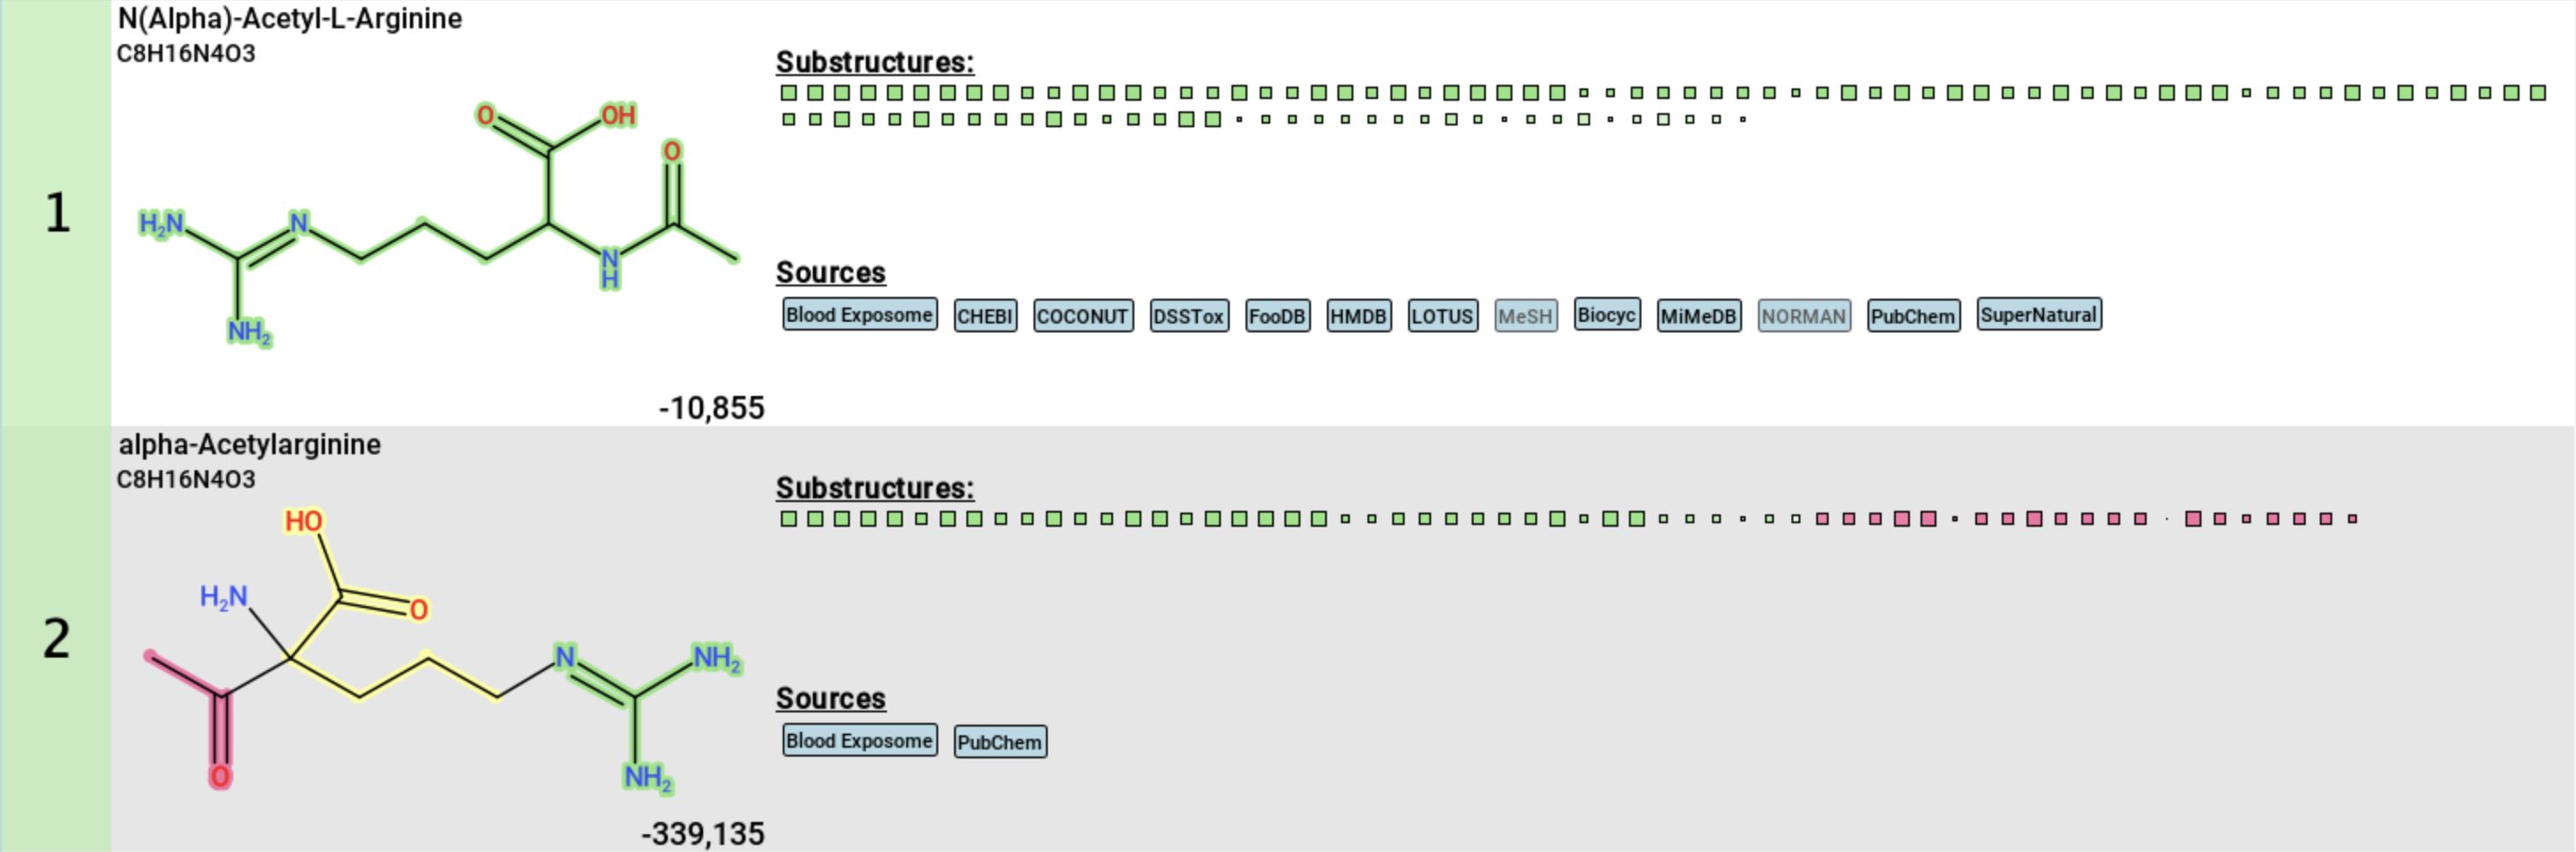
If the structure is contained in any database, a label with the name of this database is displayed below the structure [11]. Database labels have different colors:
- black on light blue: This database is linked. Clicking on the label opens the database entry in your browser [a].
- grey on light blue: This database is not linked .
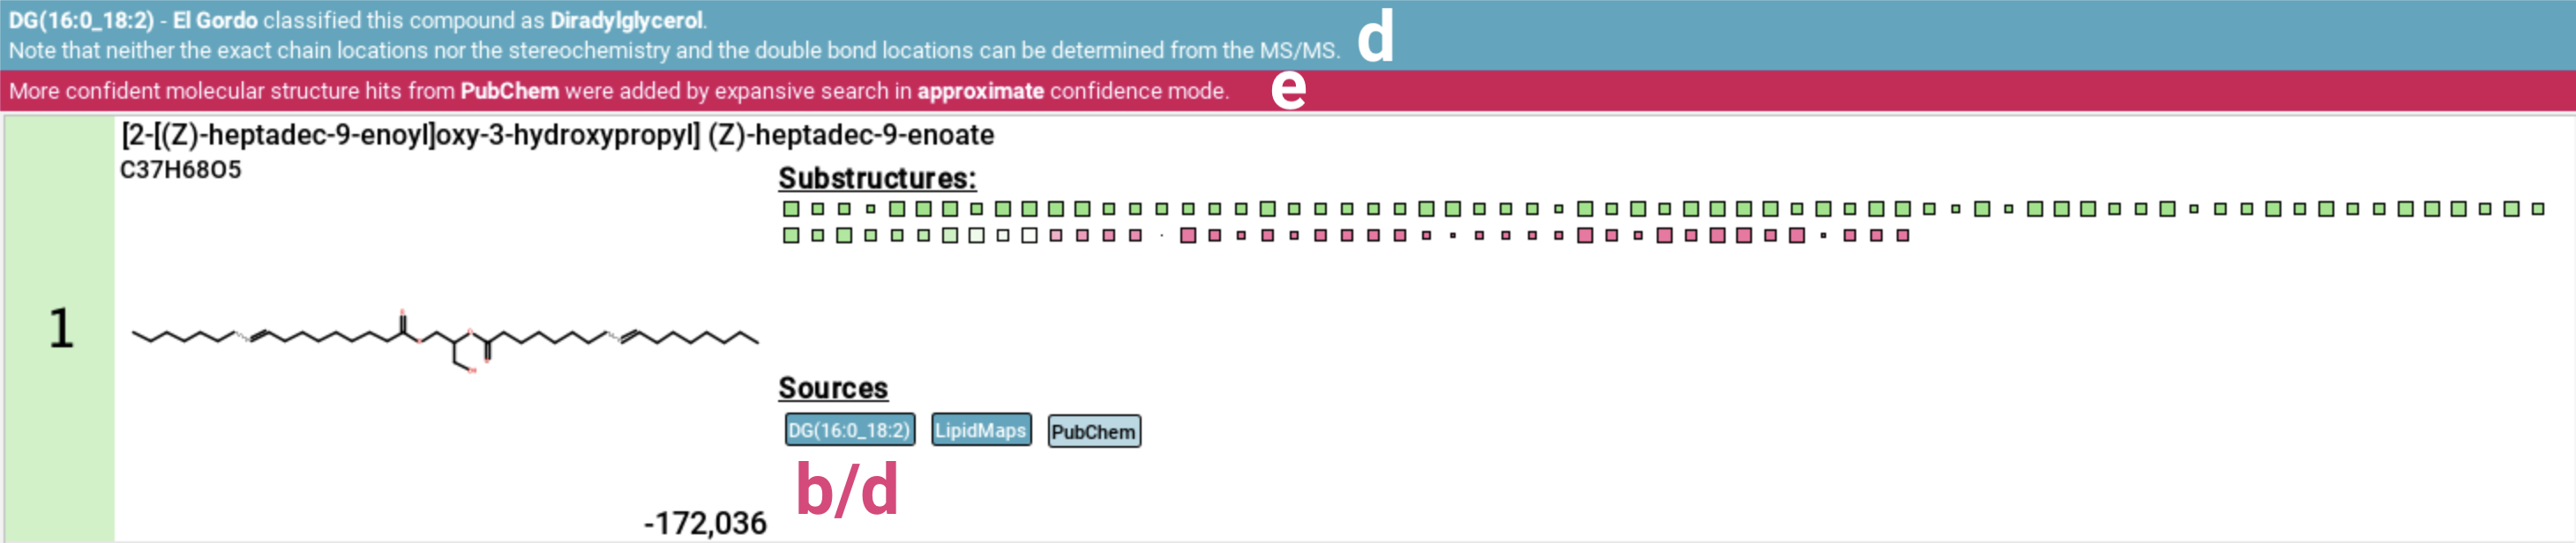
- white on dark blue: This is a lipid database [b] or lipid class annotation (El Gordo) (see below) [d].
- black on yellow: This is a custom database loaded by the user [c].
- grey on yellow: This is result from a custom database but the database has not been loaded. This can for example happen when loading results that have been computed with a custom database that is not available on the current system.
- pink: This structure has been generated by MSNovelist. Die label is only used in the De Novo Structures view.
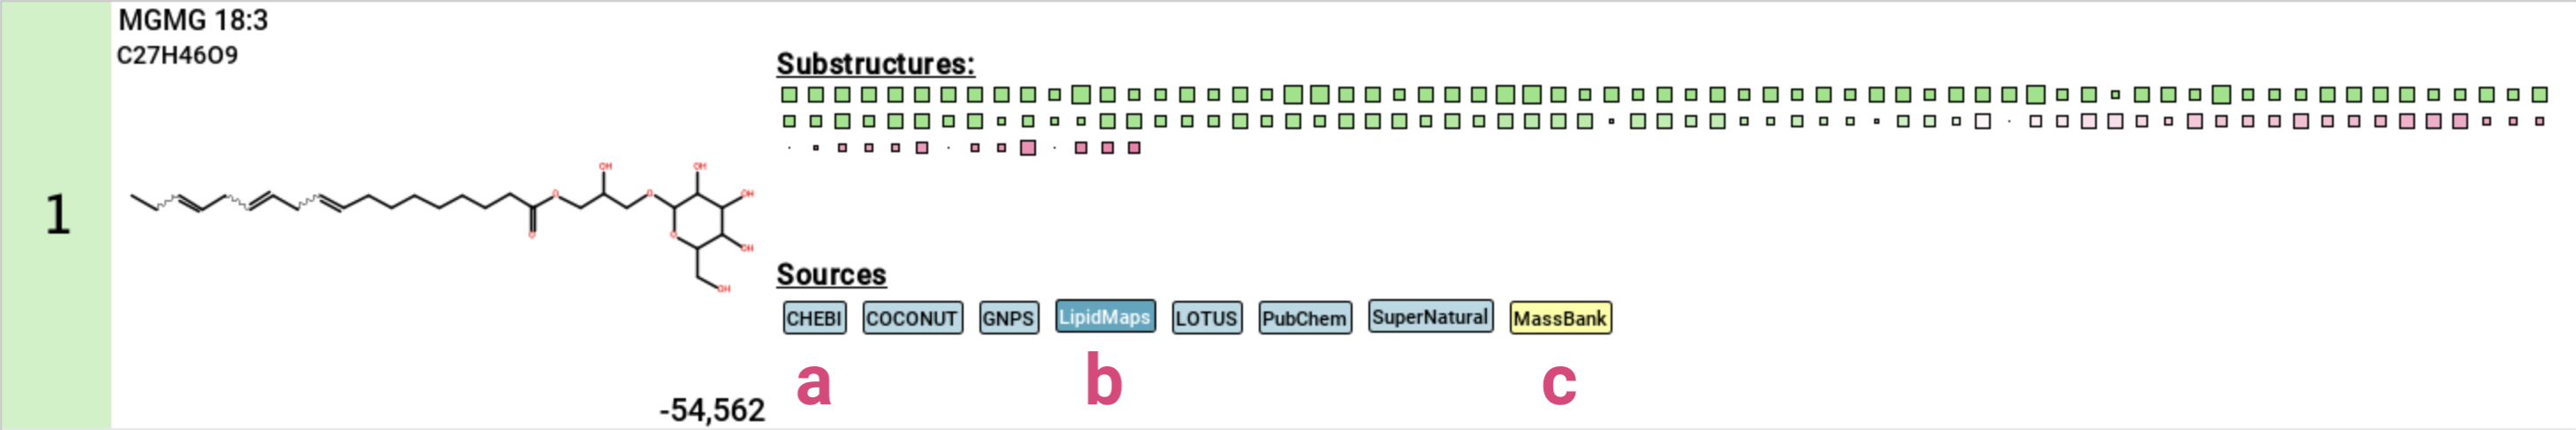
This view also includes the lipid class annotation (El Gordo) [d]. If the feature has been identified as lipid a blue notification displaying the classification will appear below the top ribbon. If the candidate structure is also a lipid, the classification will be added to the database labels. Be aware that lipid structures are often highly similar, differing only in the position of double bonds. These subtle differences can be indistinguishable using mass spectrometry alone, which is why the overarching lipid class is displayed.
If the PubChem fallback was activated as part of Expansive search, a pink notification will be displayed below the top ribbon [e].
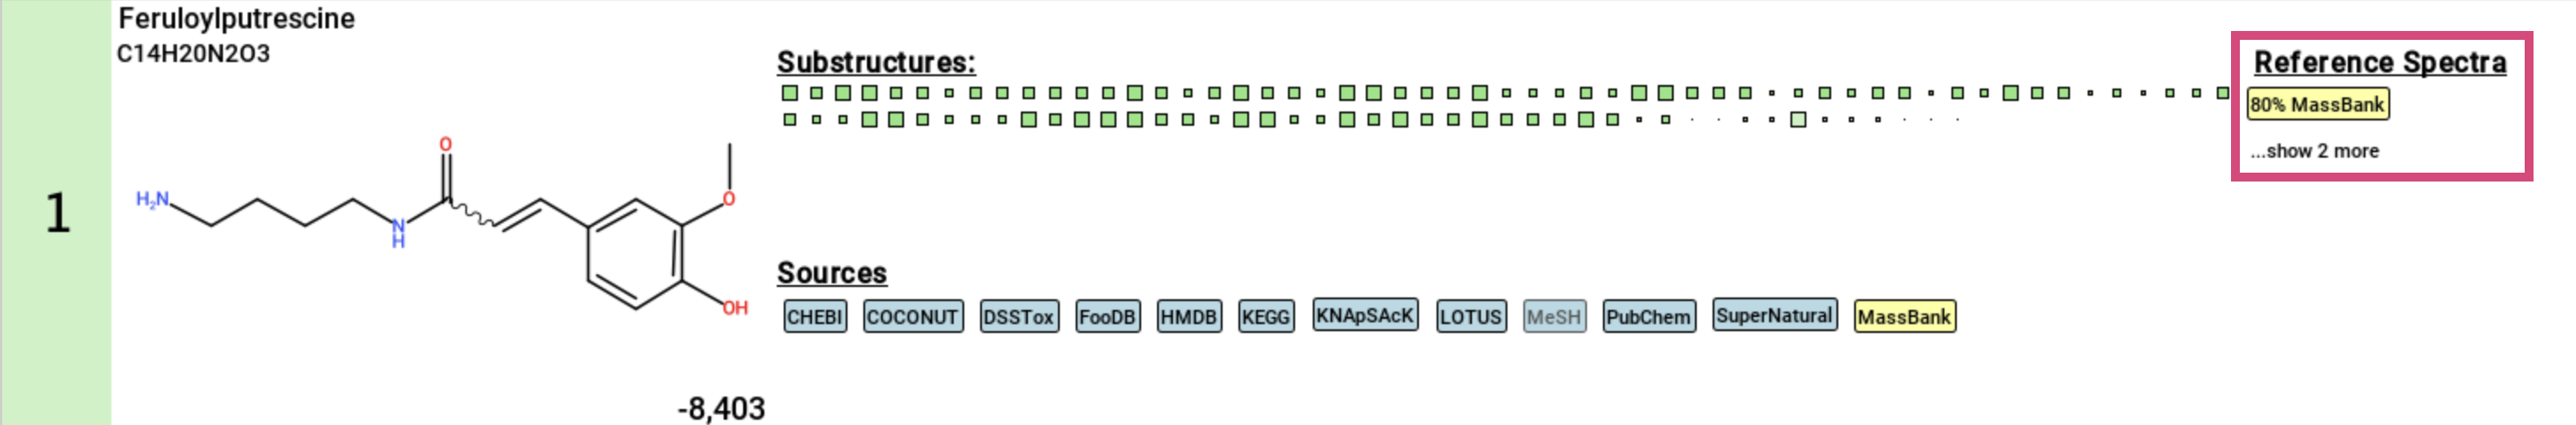
Finally, if a structure candidate has a reference spectrum imported
via a custom database, the spectral match will be displayed.
Clicking on this match will open an additional window with the Substructure Annotations view that you can use to compare the annotated structure to identity and analog spectral matches. ...show X more is the number of identity matches for this feature.
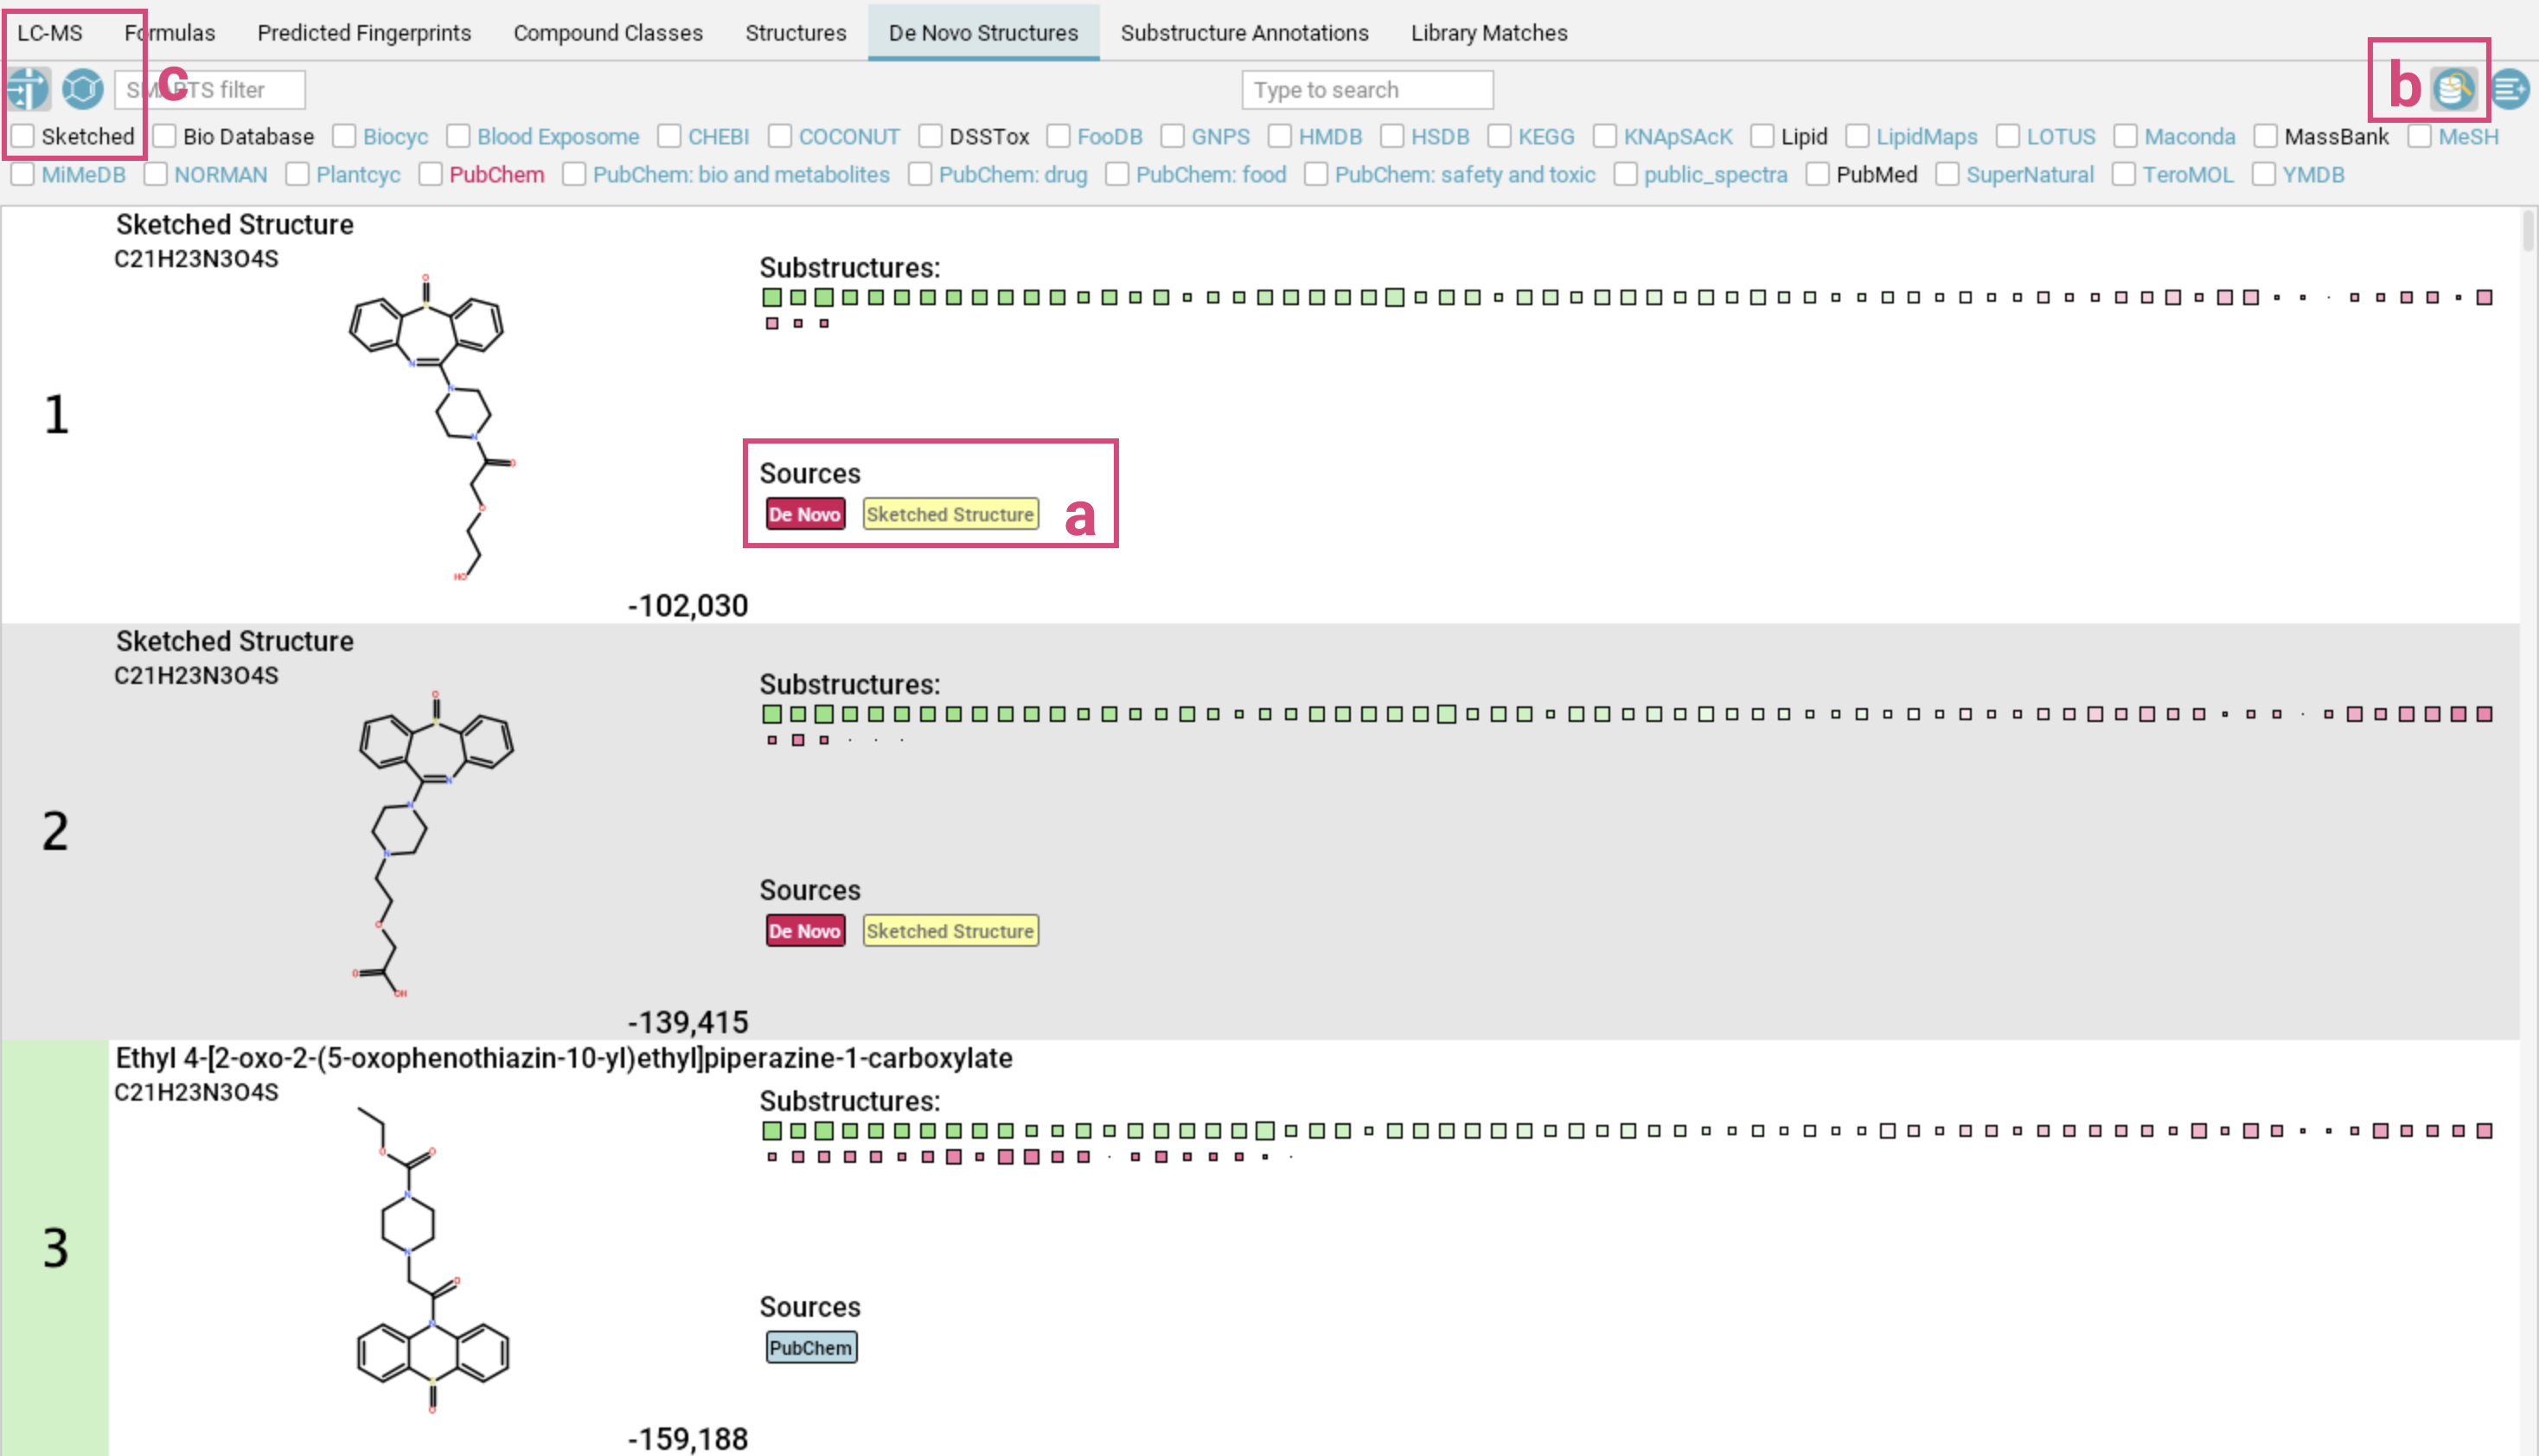
De Novo Structures view
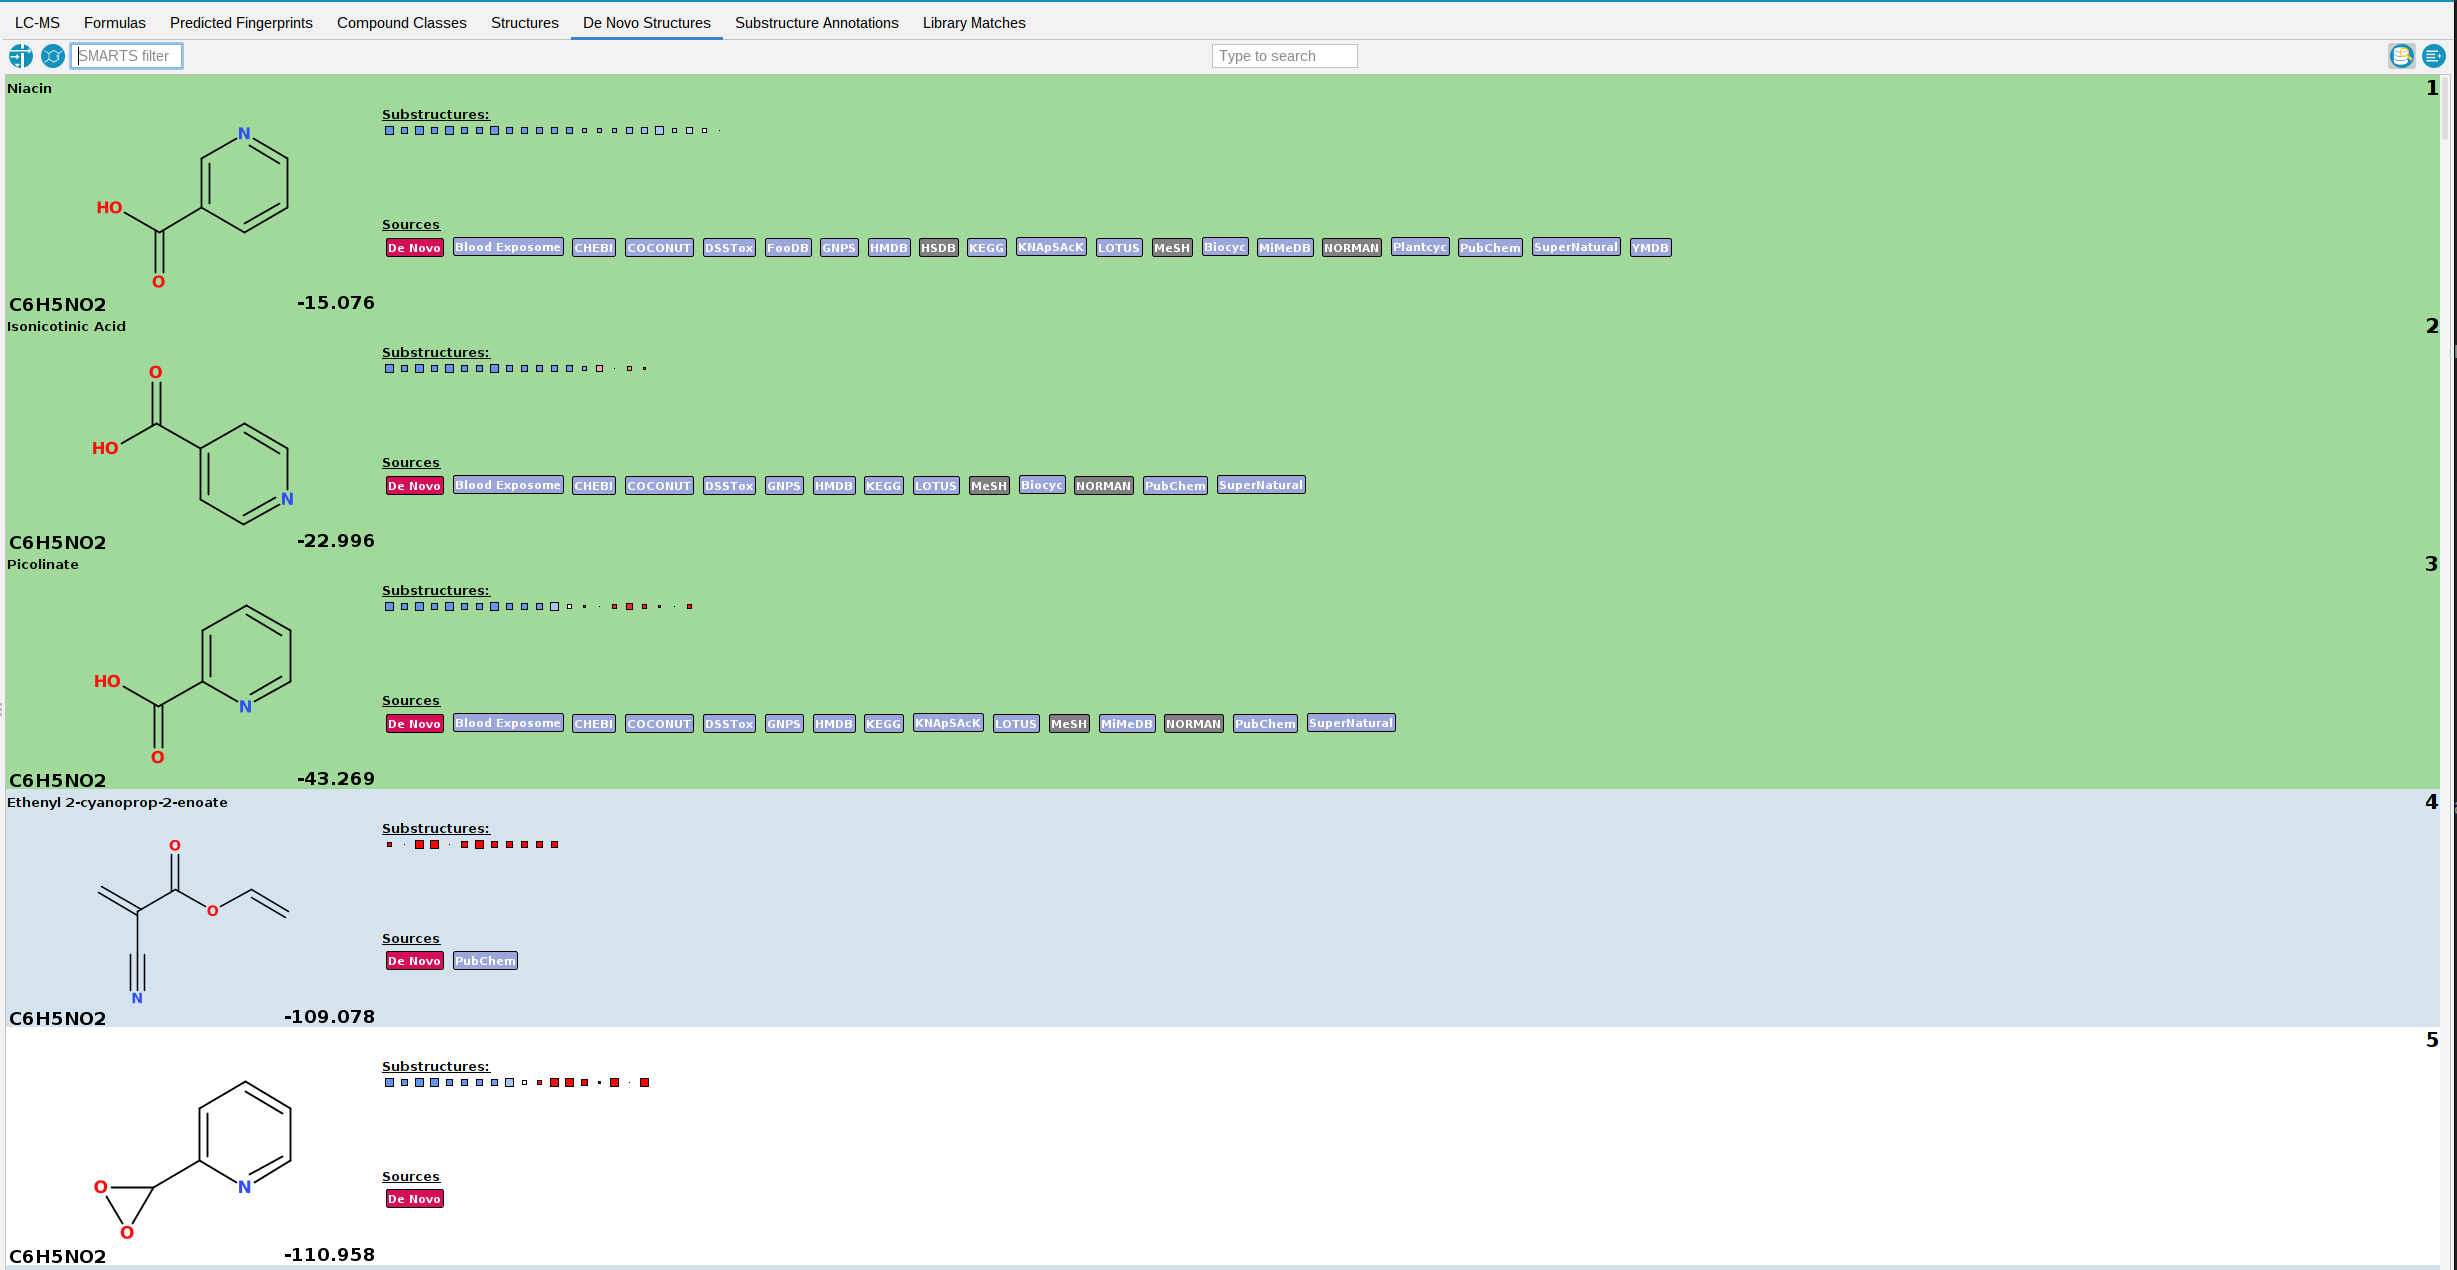
The De Novo Structures tab displays the de novo structure generation results produced by MSNovelist, with each generated structure tagged with a de novo label.
If a generated structure is also found in the structure databases, the corresponding labels will be added alongside the de novo label.
For instance, in the example screenshot above, generated structures 1-4 are generated by MSNovelist, but also exist in the structure databases. Structure 5 was only generated de novo by MSNovelist.
By default, structure candidates from the structure databases that have NOT been
generated by MSNovelist are also displayed. You can hide those structures by toggling
the left button in the top right corner. The De Novo Structures tab has the same display functionalities (filtering, context menu,…) as the Structures tab.
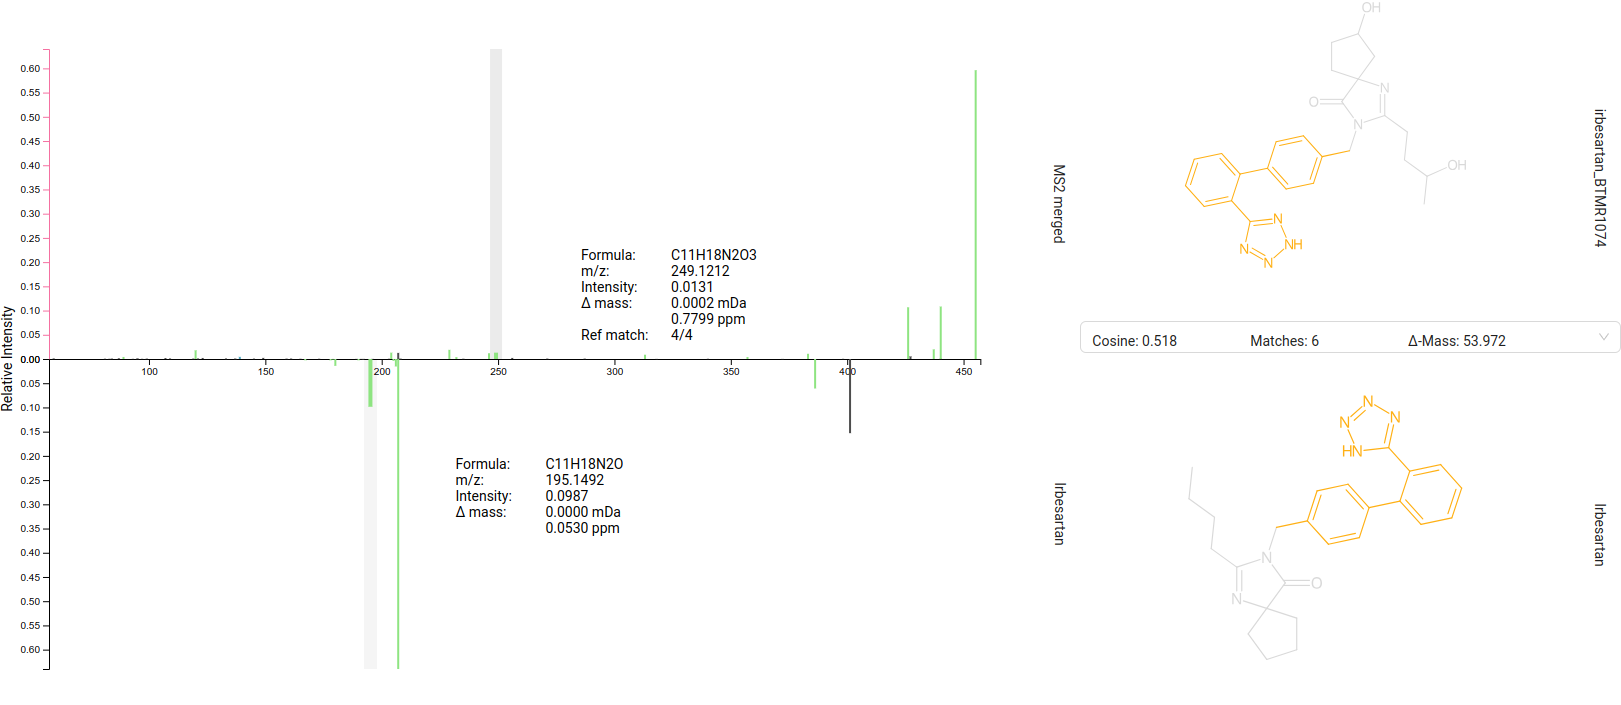
Substructure Annotation view
The Substructure Annotations tab visualizes the direct connection between the input MS/MS spectrum, the CSI:FingerID structure candidates and the (analog) spectral library matches. The substructure matching is not related to how CSI:FingerID scores structure candidates, but is a visualization tool based on combinatorial fragmentation of the candidate structure. Since combinatorial fragmentation cannot take rearrangements into account, they will not appear here, although CSI:FingerID can annotate structures that form rearrangements during fragmentation.
Details of this view are also covered in our Tutorial Series.
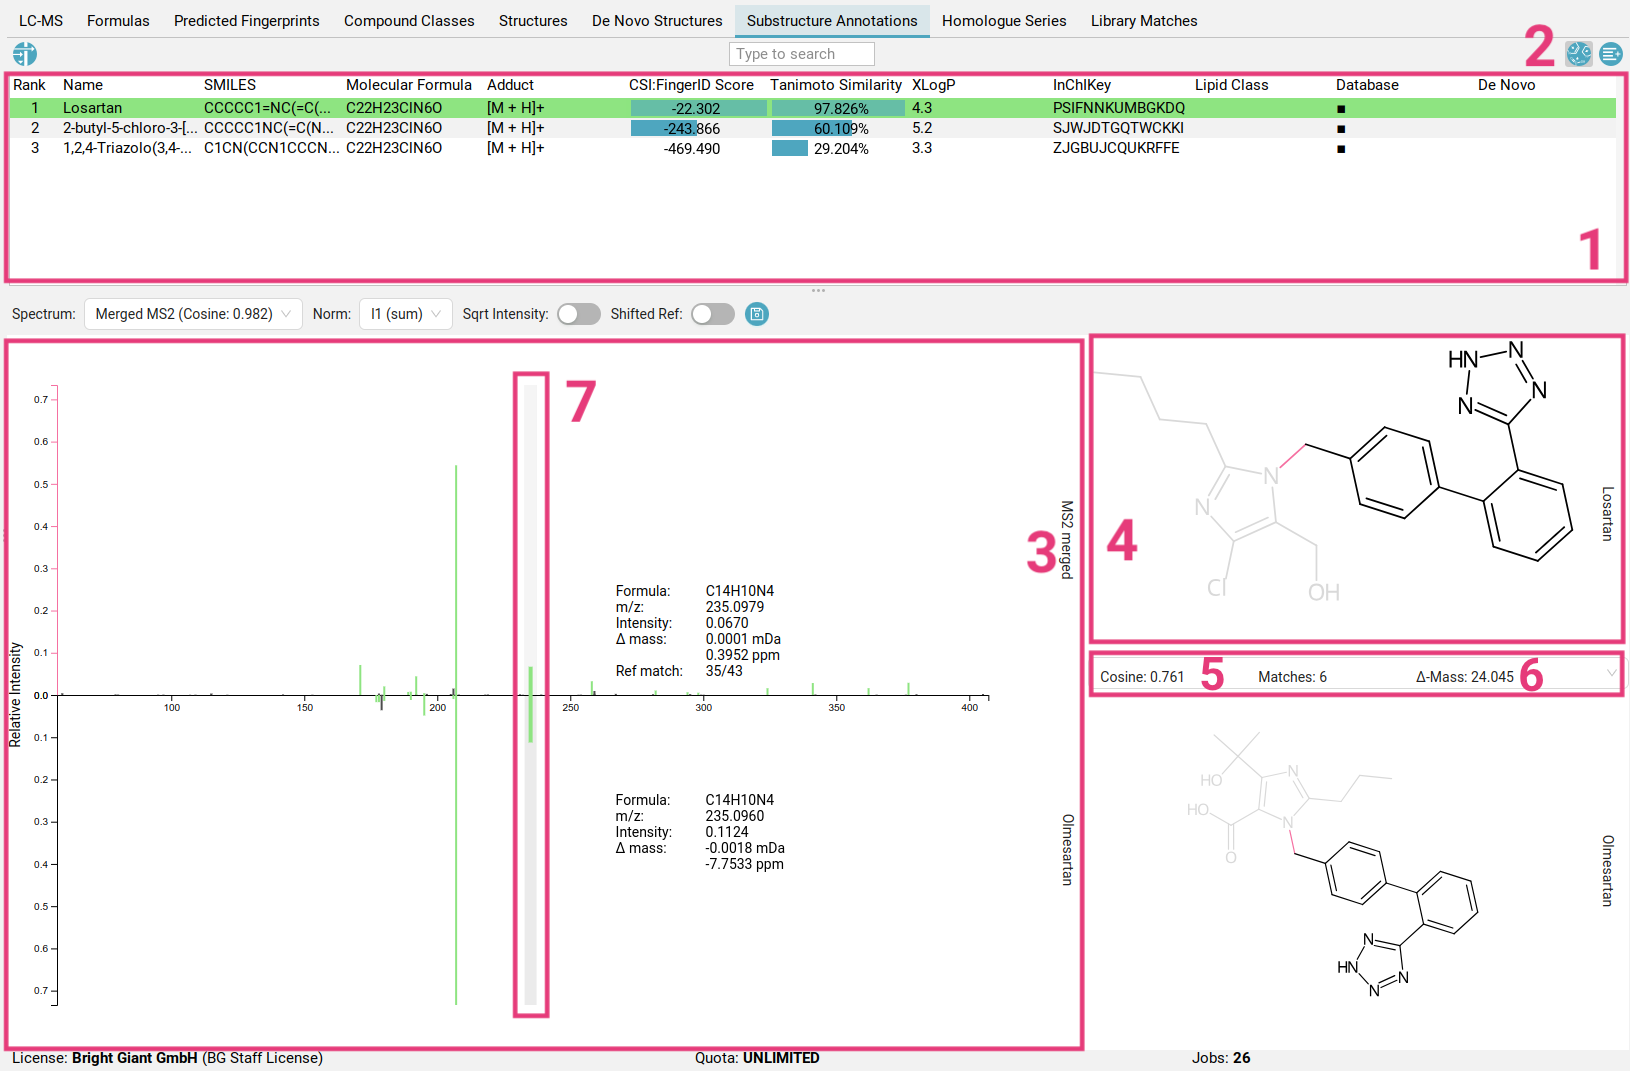
The table at the top [1] displays all structure candidates for a given query (as listed in the Structures tab), and all structure candidates generated
by MSNovelist. You can hide/unhide MSNovelist-generated structures by toggling
the left button in the top right corner [2]. Read here how to filter the results list.
When you select a structure from the list, the view shows the fragmentation spectrum on the left [3] and the selected structure candidate on the right [4].
Peaks in the fragmentation spectrum are color-coded as follows:
- Black peaks: These peaks are not used to explain the molecular formula of the candidate and are not part of the fragmentation tree (similar to the spectrum in the Formulas view. Typically, these peaks are considered noise or are not explainable by the precursor ion’s molecular formula.
- Blue peaks: These peaks are part of the fragmentation tree and thus explain the molecular formula of the candidate. However, they do not have a substructure associated to them.
- Green peaks: These peaks explain the molecular formula of the candidate, AND are associated to a substructure of the candidate structure. Substructures are generated combinatorially and then scored against the peaks. By clicking on the peak, the highest scoring substructure for this peak will be highlighted within the structure. Pink bonds indicate the fragmentation that would have occurred to generate this fragment.
You can navigate through the peaks using left-click or the arrow keys.
To inspect the peak annotations in the context of a spectral library match, select an available match from the dropdown menu [5]. Matches can result from identity spectral library search (same precursor mass), or analog search (Δ-Mass [6]). Selecting a peak will automatically highlight the corresponding peak in the matched spectrum that was determined during cosine matching [7]. The highlighted spectrum alongside the spectral match and the substructure annotation of the selected peak can be exported as PNG or SVG file [8].
If the current library match we are inspecting is an analog match, some peak matches will represent shared losses instead of shared fragments. The corresponding loss’s substructure is highlighted in yellow instead. Using right-click on a selected peak, you can bring up a context menu to help find reference spectra that explain the specific peak.
Library Matches view
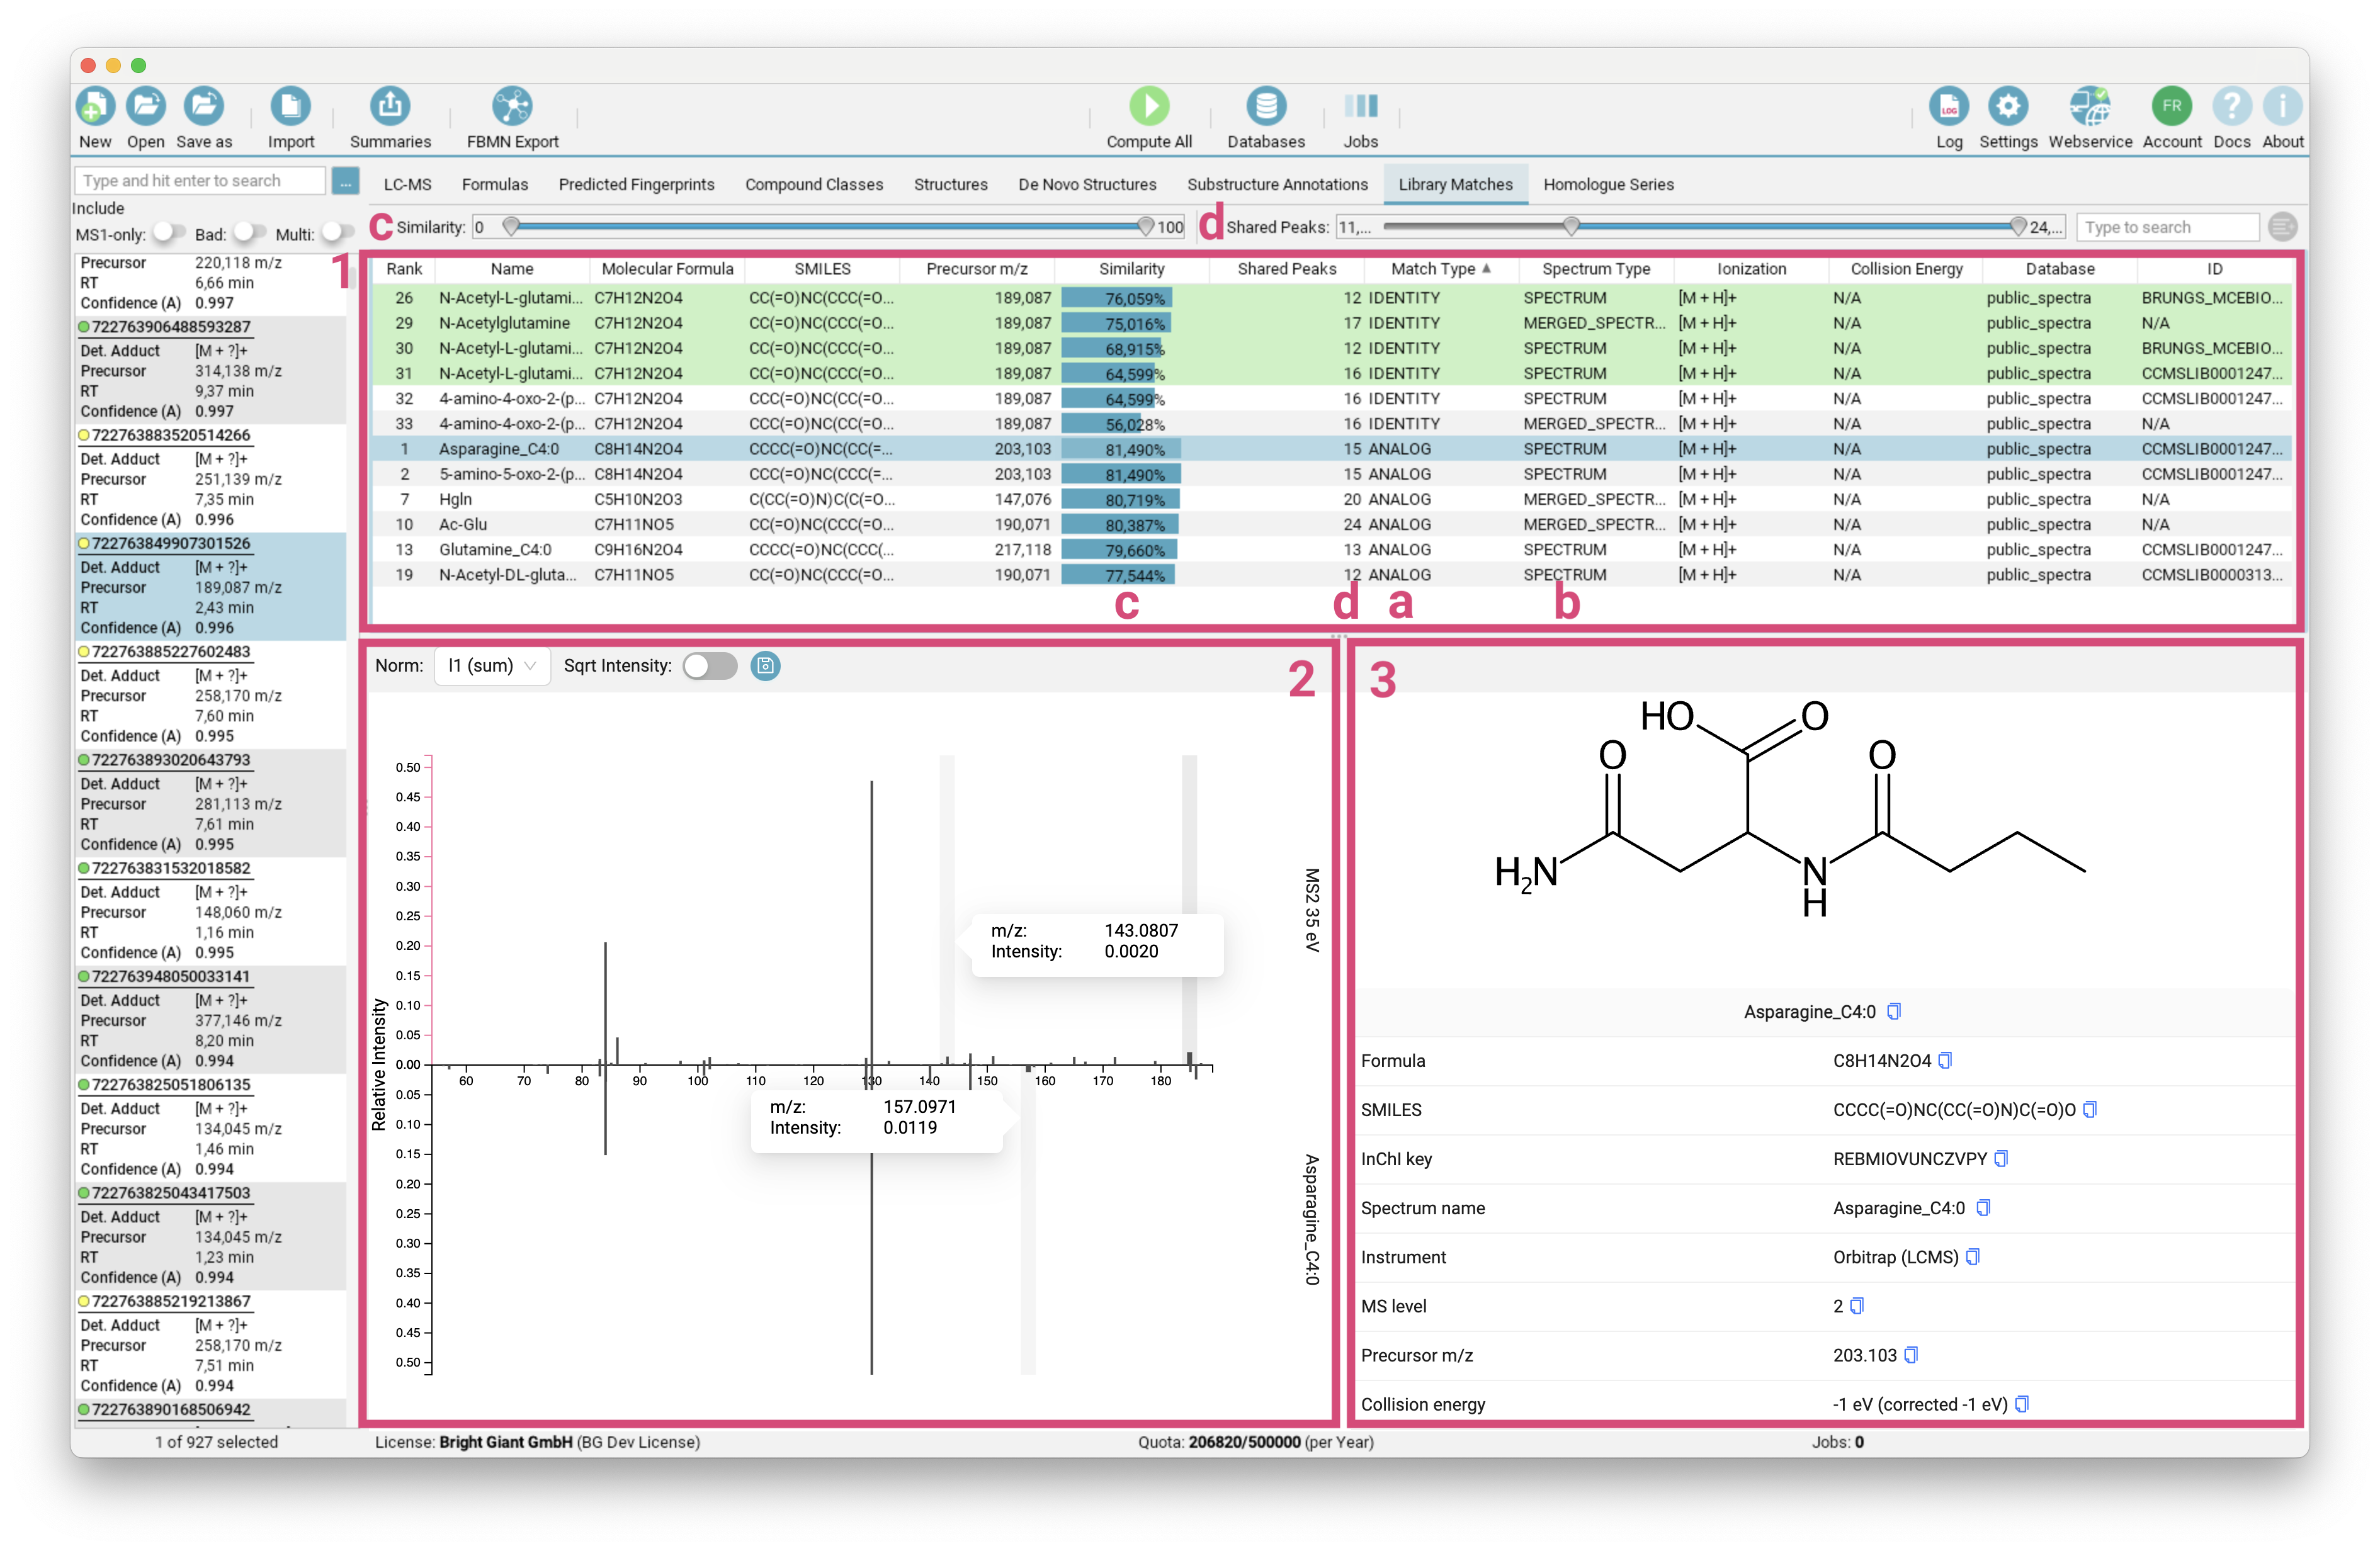
The Library Matches tab lists [1] all IDENTITY and ANALOG [a] spectral library matches for the selected feature. For fast spectral search, spectra are grouped into clusters (by molecular structure and adduct type) with a merged spectrum as representative. The MERGED_SPECTRUM is also treated as valid hit [b]. You can refine the displayed list by adjusting the Similarity Score and number of Shared Peaks range [c]/[d].
The selected library match is displayed as mirror spectrum, allowing for a direct comparison with your measured spectrum [2]. Hovering over a peak reveals its m/z and intensity, along with the corresponding matched peak in the mirror spectrum, which is particularly useful for analog matches. The structure and additional metadata of the selected library hit are provided on the right side of the interface [3].
For more information on spectral library searches in SIRIUS, please refer to the sections on spectral library matching and Import of Custom Structure and Spectra Databases.
Activate spectral library results tab
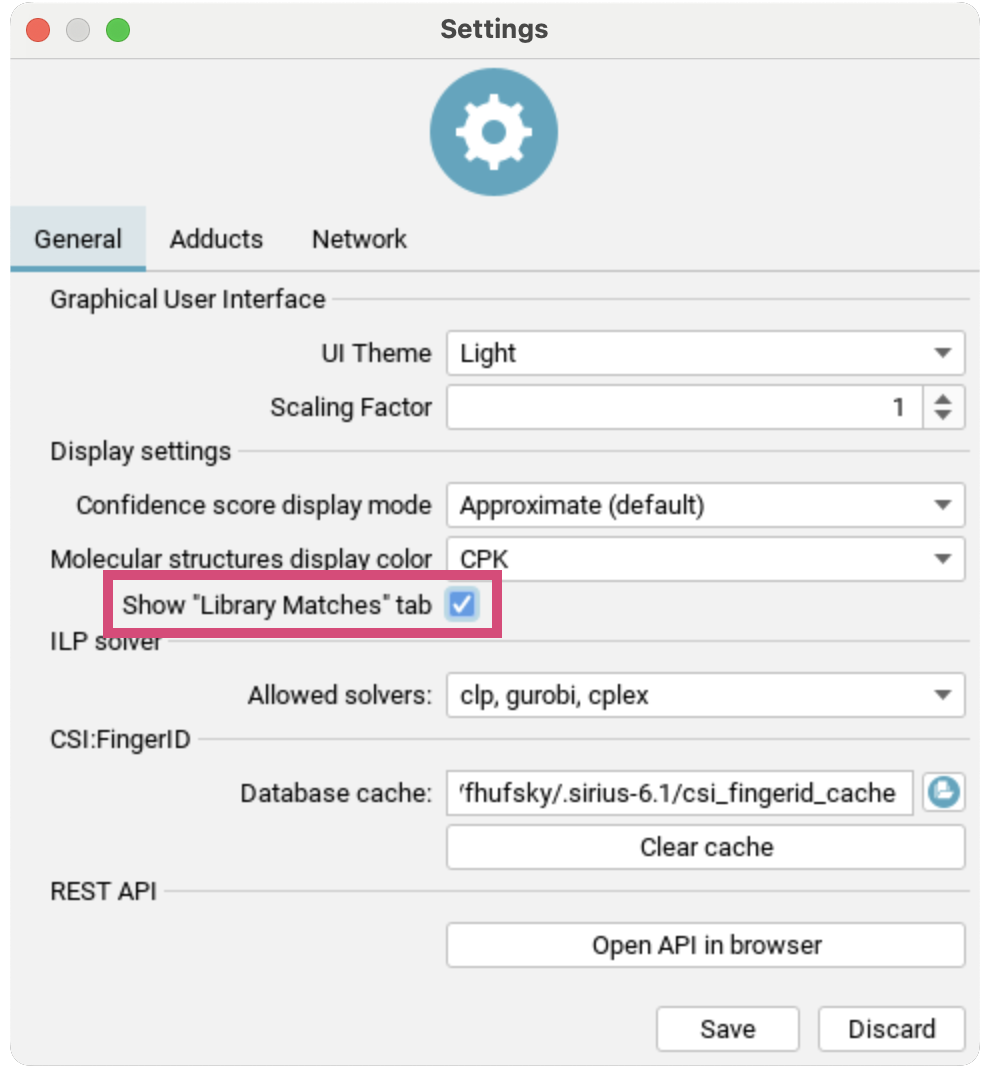
To additionally activate the Library Matches tab, go to Settings and check Show "Library Matches" tab. You will get a warning dialogue explaining the spectral library search settings:
- A spectral library is also a molecular structure database. ANY hit in the spectral library can also be found via CSI:FingerID structure database search.
- Since structure database results depend on the selected molecular formula, SIRIUS ensures that molecular structures with a formula corresponding to a good spectral library hit are considered - even if this molecular formula receives a low score, i.e. molecular structures of well-matching reference spectra are automatically included in the structure database search.
- Structure database search is only performed on databases selected by the user. To ensure that all your spectral libraries are considered by CSI:FingerID, select these libraries (databases) in the structure database search step.
Homologous Series view
The Homologous Series view helps you quickly find groups of related molecules, known as homologous series, within your complex samples using a Kendrick Mass Defect (KMD) plot [1].
Think of a homologous series as a family of molecules that share the same basic structure but differ by a consistent building block [2], like a CH2 (methylene) group.
The Kendrick mass scale sets the exact mass of such a repeating unit to an integer value. The KMD is then calculated as the difference between the exact Kendrick mass and its nominal (integer) Kendrick mass. When data is transformed to the Kendrick mass scale and the KMD is plotted against the nominal Kendrick mass, a distinctive pattern emerges for homologous series. On a KMD plot, features belonging to the same homologous series will exhibit the same (or very similar) Kendrick mass defect. This results in these features aligning horizontally on the plot.
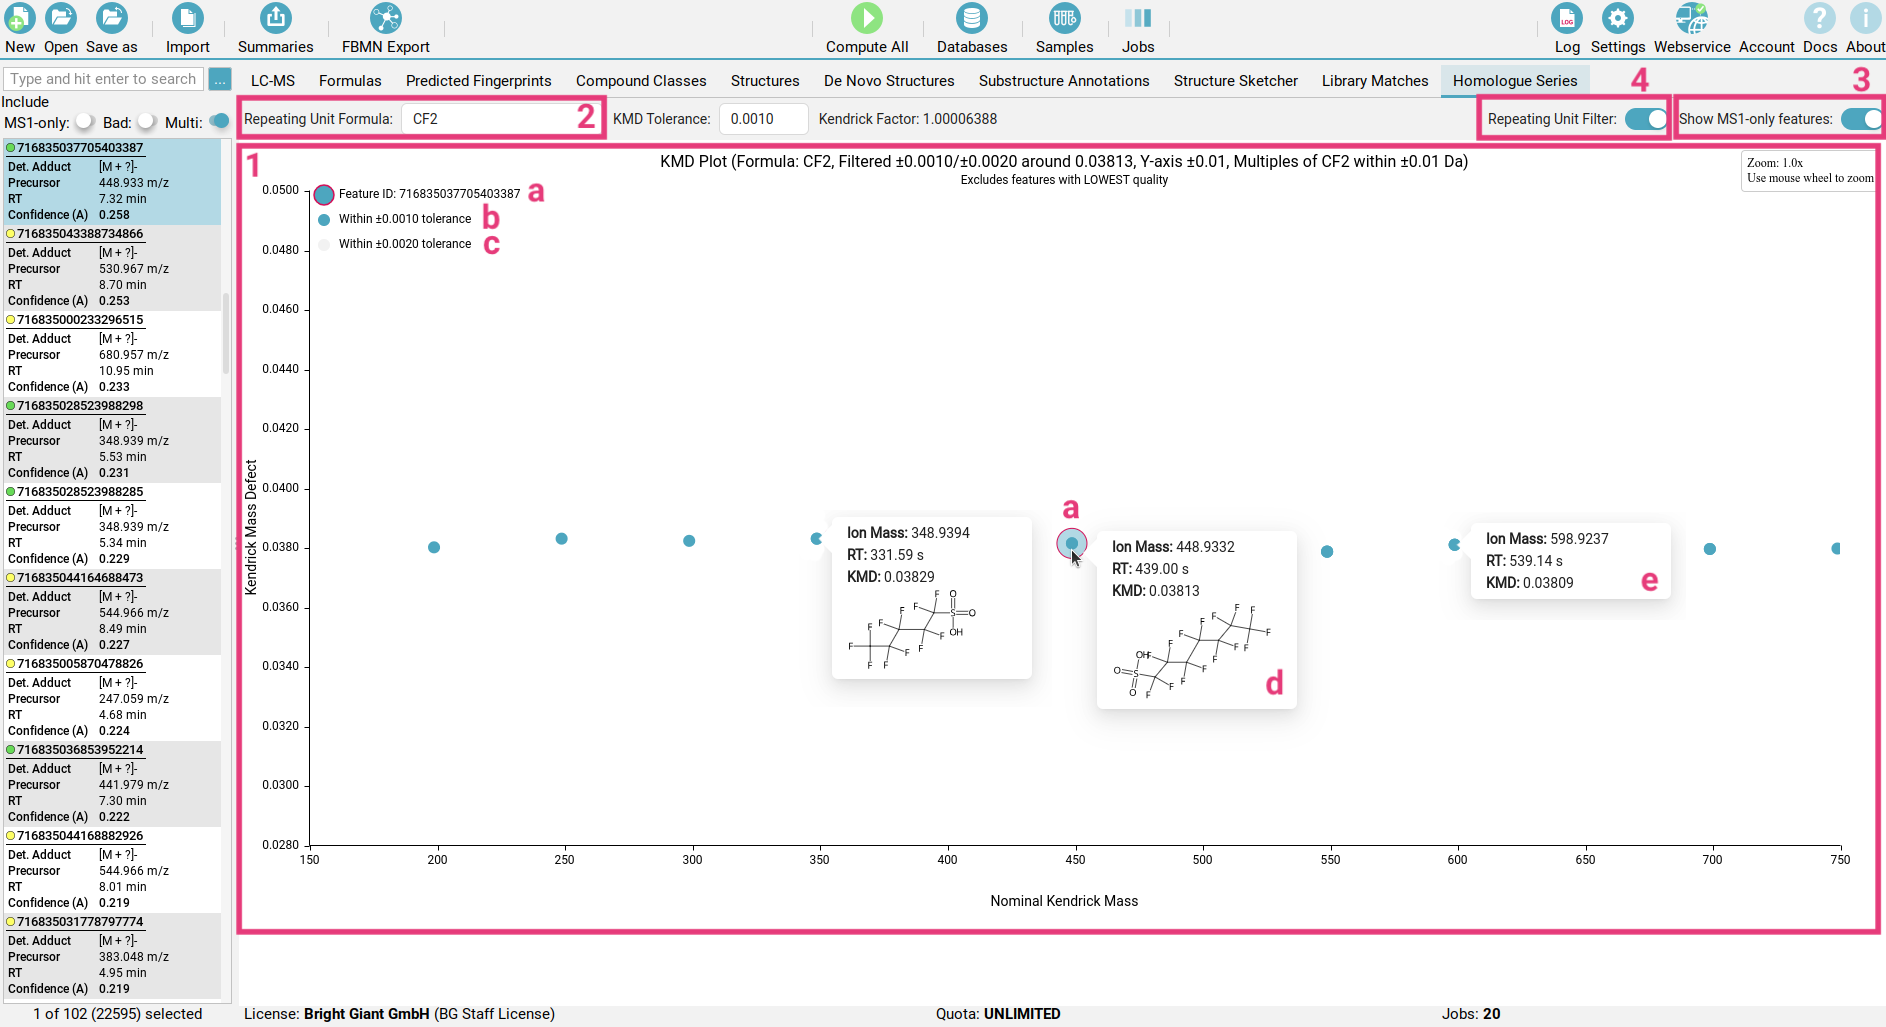
In the Homologous Series view you can select your repeating unit of interest [2] to define the homologous series you want to visualize. The currently selected feature is highlighted with a pink outline [a]. All features within a chosen KMD tolerance will appear as blue dots [b], while those at twice the tolerance are shown as light grey dots [c].
Hovering over any dot will reveal the top CSI:FingerID structure identified for this feature [d].
If you include MS1-only features [3], no structure will be available for those features [e]. Right-click on the dot offers direct navigation (jump) to related features.
Activate tab
To activate the Homologous Series tab, go to Settings and check Show "Homologous Series" tab. KMD plots are available after data import. Structure annotations are available after Structure database search.
Structure sketcher
The Structure Sketcher enables users to manually modify candidate structures and integrate these new structures into the list of candidate structures. To access the Structure Sketcher, navigate to the Structures view. Right-click on any of the candidate structures and select Modify structure from the context menu. This action will launch the Structure Sketcher in a separate window. The interface of the Structure Sketcher is divided into two primary sections: the sketching area is located on the right [1] and powered by Ketcher, an open-source web-based chemical structure editor. Users can draw and modify chemical structures within this section. The list of allowed molecular formulas is positioned on the left [2] and displays all molecular formula candidates for which a fingerprint has been predicted.
This pane also provides immediate feedback if an error occurs while attempting to add a structure candidate. This feedback is triggered if no fingerprint was predicted for the molecular formula or if the generated structure is already in the candidate list, preventing the creation of a redundant entry.
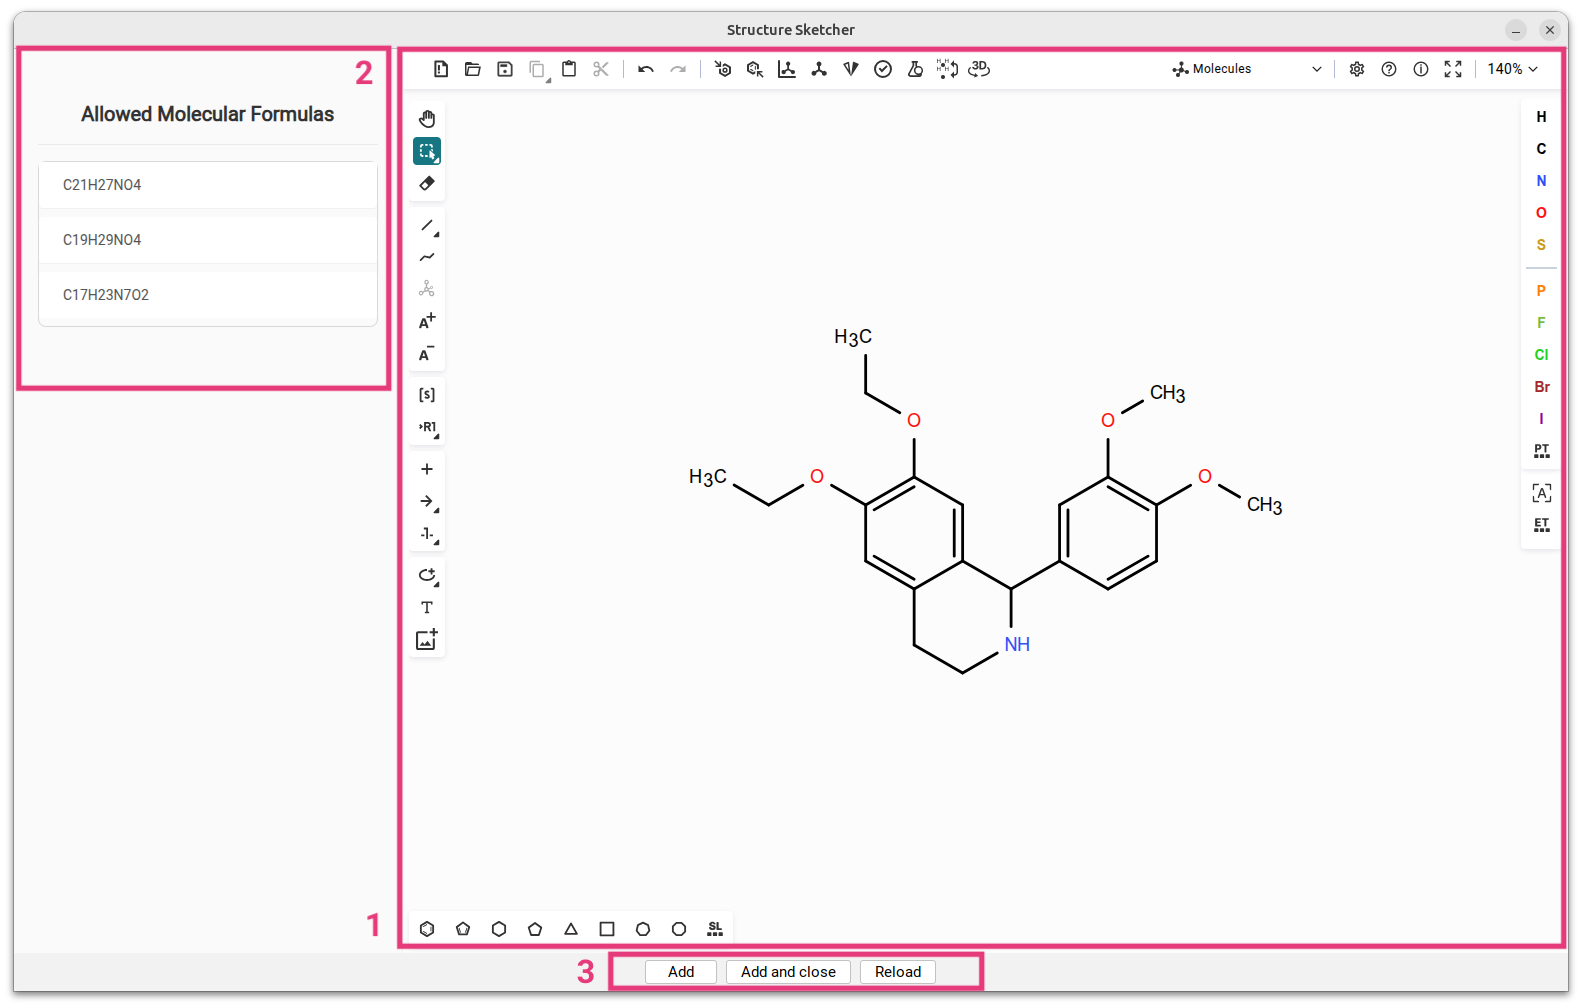
When modifying a candidate structure, ensure that the altered structure conforms to one of the allowed molecular formulas [2]. Failure to do so will result in an error message indicating that no fingerprint was predicted for the generated molecular formula. Once modifications are complete, click either Add [3] to include the new structure in the candidate list while keeping the sketcher open, or Add and close to add the structure and close the sketcher window.
If the structure is already in the candidate list, you will get a warning, that the Structure candidate already exists.
You can click Reload to revert to the structure you started with.
After closing the Structure Sketcher, switch to the De Novo Structures view (usually done automatically) to observe the newly added candidates. Sketched structures are labeled Skteched structure [a].
Various filters are available to help manage and review the updated list. For example, users can toggle the display of database hits [b] or apply the database filter called Sketched [c] to show only the manually sketched candidates.
Finally, the Substructure Annotations view can be utilized to verify if the manually sketched candidate provides a more effective explanation for the observed peaks.
Data export (Summaries and FBMN export)
Analysis results can be exported using the Summaries button in the top left tool bar.
Summary files include five types of data:
- formula annotation summaries
- CANOPUS summaries
- structure database search summaries
- MSNovelist summaries
- spectral library matching summaries.
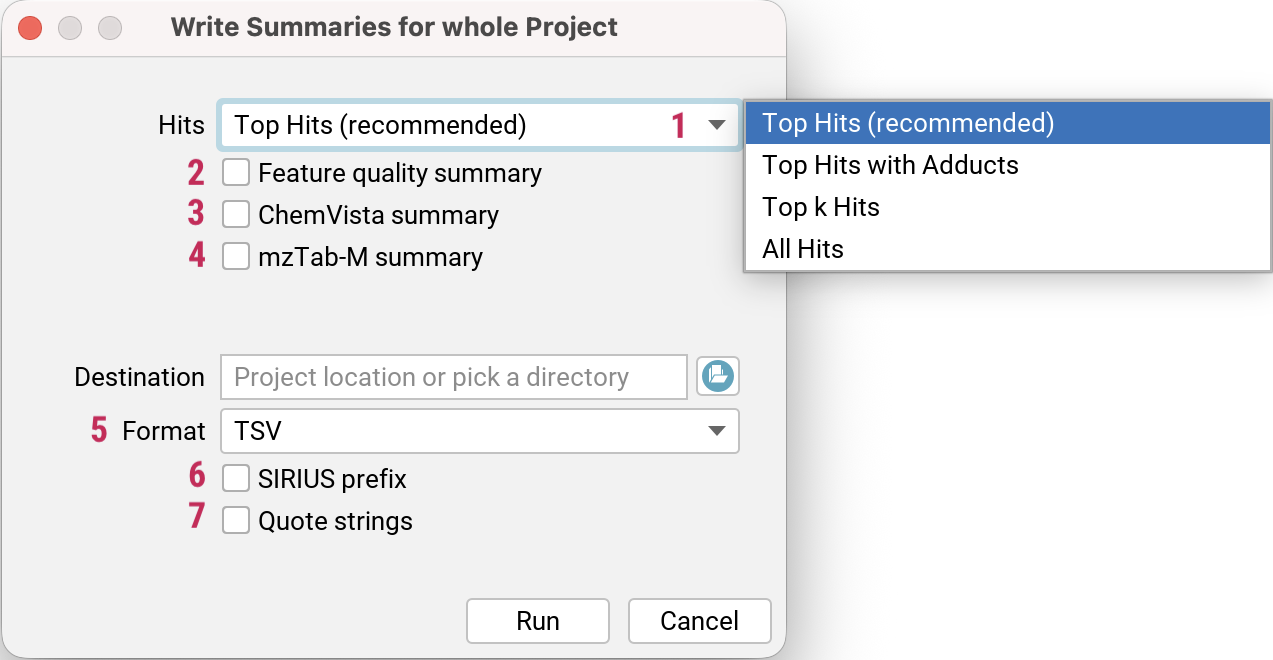
By default, only the top hit is exported for each feature (Top Hits (recommended)) [1]. You can use the drop down menu to export All Hits, Top k Hits, or Top Hits with Adducts instead. Learn more about the different export options here.
In addition, you can export a Feature quality summary [2], with feature quality values of different categories for all features, as well as a ChemVista summary file [3]
which can be imported directly to the Agilent ChemVista software.
For sharing data with third-party tools or data archives, you can export an analysis report in the standardized mzTab-M format (analysis_report.mztab) [4].
You can export the files in TSV, CSV, ZIP or XLSX format [5]. The SIRIUS prefix option [6] will add a SIRIUS_ prefix to all column headers in the summary files for better identification when merging data in external tools.
You might want to use Quote strings [7] to quote all string values.
Feature based molecular networking (FBMN) export
TODO
Settings
You can access the settings dialog by clicking the Settings button at the top right of the user interface.
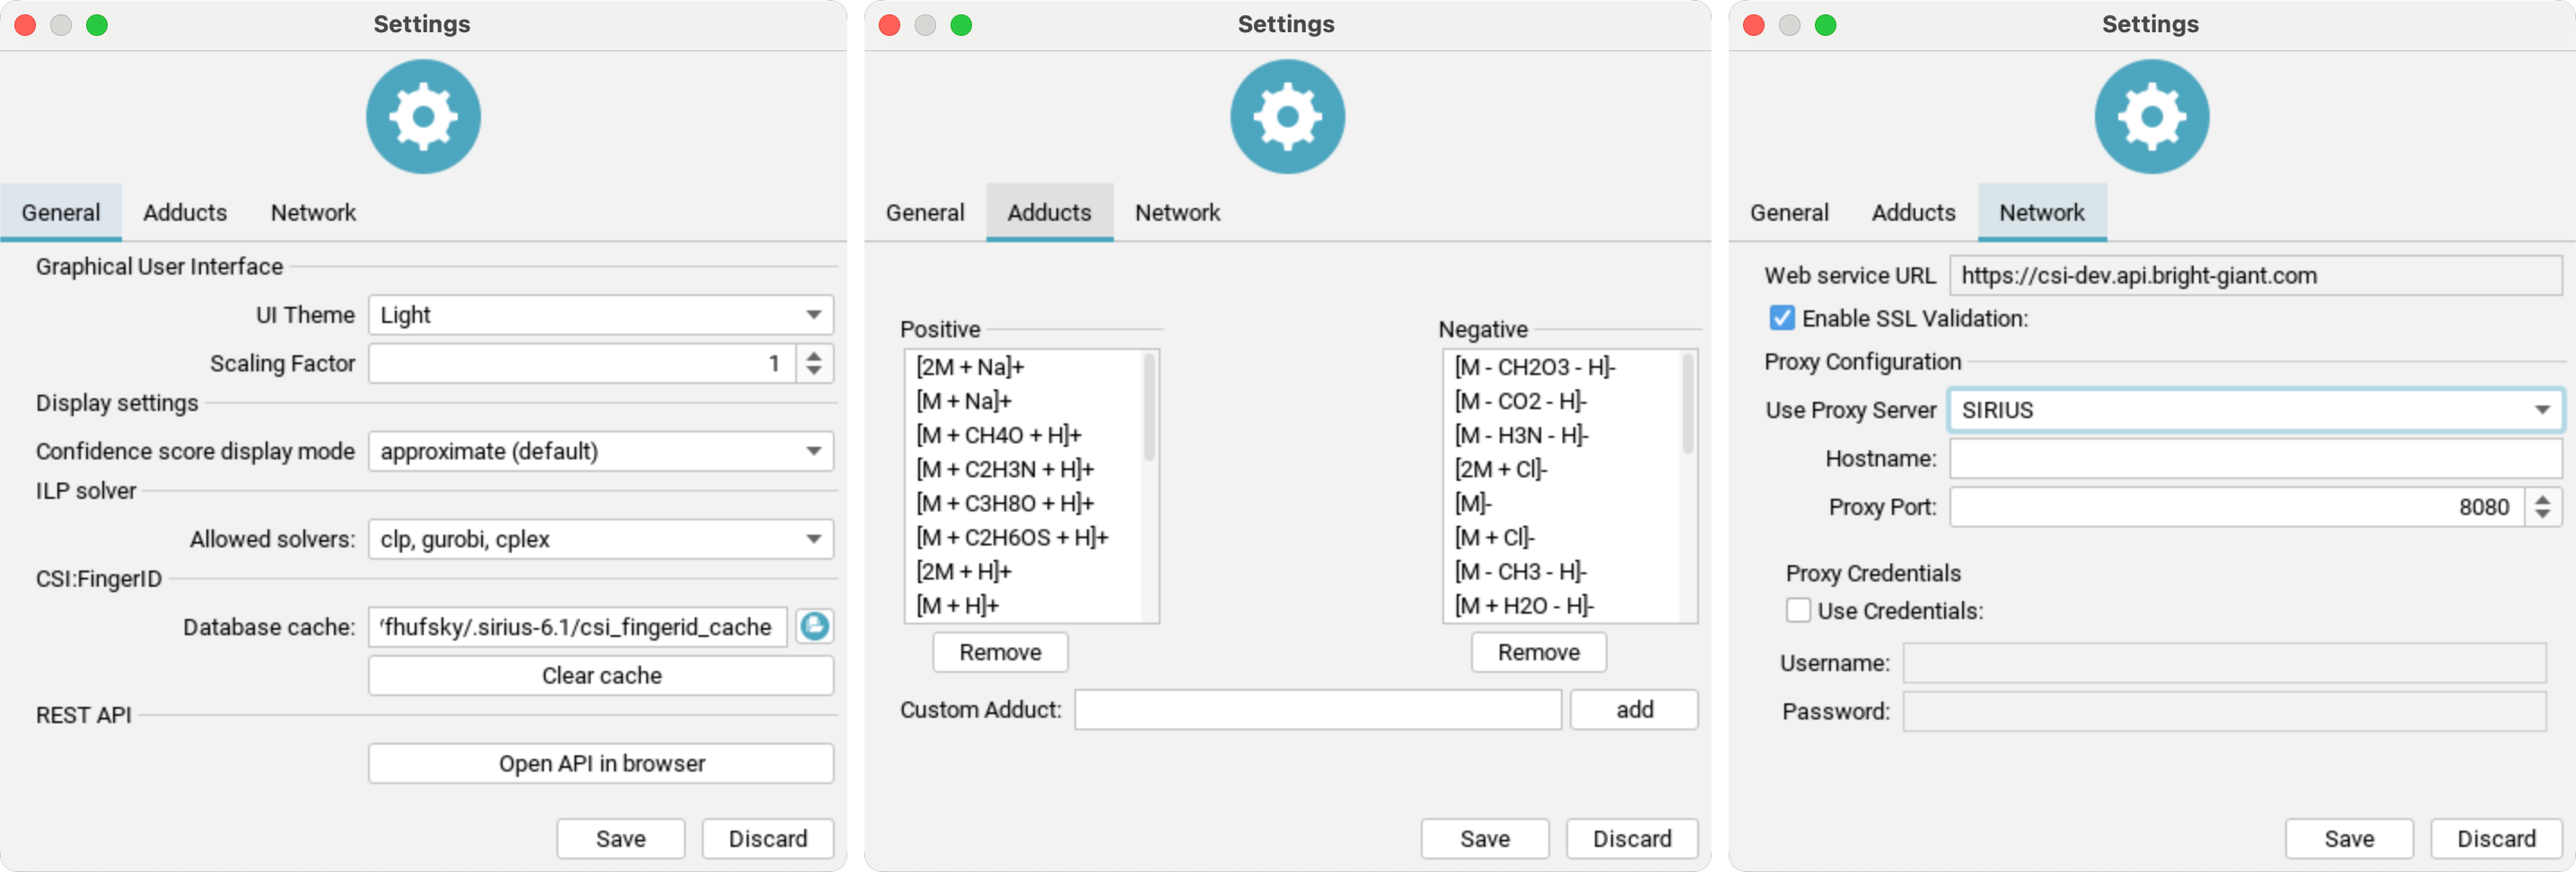
General settings:
UI Theme: Choose your preferred display mode to reduce eye strain (requires restart).Scaling Factor: Adjust the size of the GUI by the selected factor (requires restart).Confidence score display mode: Sets the mode for displaying the confidence score (eitherapproximateorexact).Molecular structure display color: Enable/disable CPK colors for all structuresShow "Library Matches" tab: TheLibrary Matchescan be activated here after agreeing to a warning dialogue explaining the spectral library search settingsAllowed solvers: Select the ILP solver for SIRIUS to use in fragmentation tree computation. GLPK is free, while Gurobi is commercial but offers a free academic license.Database cache: Specifies the location of the cache directory. CSI:FingerID downloads candidate structures from our server and caches them for faster retrieval.Presets: Open compute dialog to view and edit computation presetsREST API: Use the button to open the API in your browser. The REST API provides the full functionality of SIRIUS and its web services as background service. It is intended as entry-point for scripting languages and software integration SDKs.
Adduct settings: Add or remove custom adducts for positive and negative ion modes.
Network settings:
SIRIUS supports using a proxy server to access our webservices by changing Use Proxy Server from NONE to SIRIUS and entering all required information. Your configuration will be tested when you click the save button.
Webservice
The webservice connection check dialog, accessible via the Webservice button in the top right, helps diagnose any connection issues.
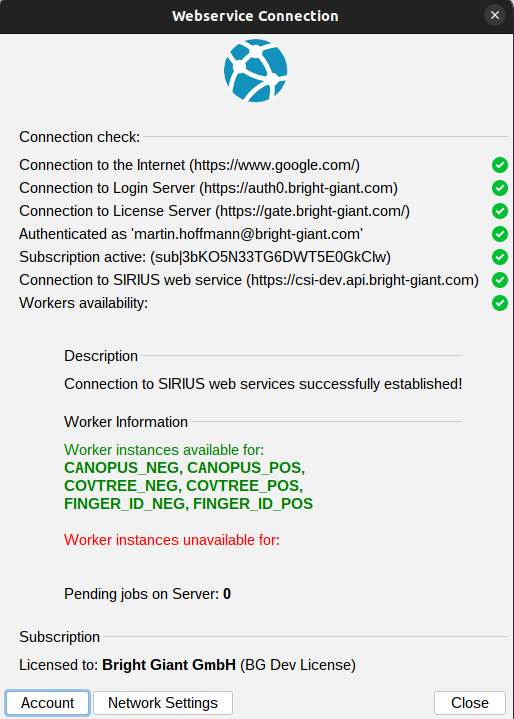
Green checkmarks or red crosses indicate whether you are successfully connected to the internet, login server, license server, and web service. It also provides information about your account’s subscription status, showing whether a valid subscription is linked to the account you’re currently logged into. If there are any connection or licensing problems, detailed descriptions and potential solutions will be provided in the description box.